
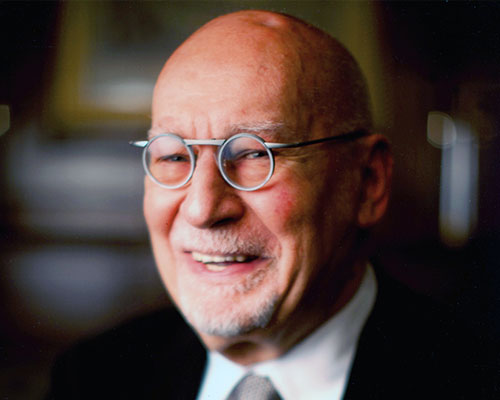
nicholas felton
photo by noah kalina
nicholas felton spends much of his time thinking about data, charts and our daily routines. he is the author of many personal annual reports that weave numerous measurements into a tapestry of graphs, maps and statistics reflecting the year’s activities. he was one of the lead designers of facebook’s timeline and the co-founder of daytum.com. his most recent product is reporter, an iPhone app designed to record and visualize subtle aspects of our lives. his work is a part of the permanent collection at MoMA. he has also been profiled by the wall street journal, wired and good magazine and recognized as one of the 50 most influential designers in america by fast company.
designboom: can you remember what first sparked your interest in graphic design?
nicholas felton: I was always drawn towards the kids in my class who were more creatively talented than myself, I loved to watch them drawing. then, in high school one of my friends and I started a comic book with the idea that we might get noticed by someone at the studios we wanted to work at in california, (where we grew up) companies like pixar and industrial light & magic. my friend would work on the drawings and I on the production. that project is where I began learning the software and processes of graphic design and then I went on to study at RISD.
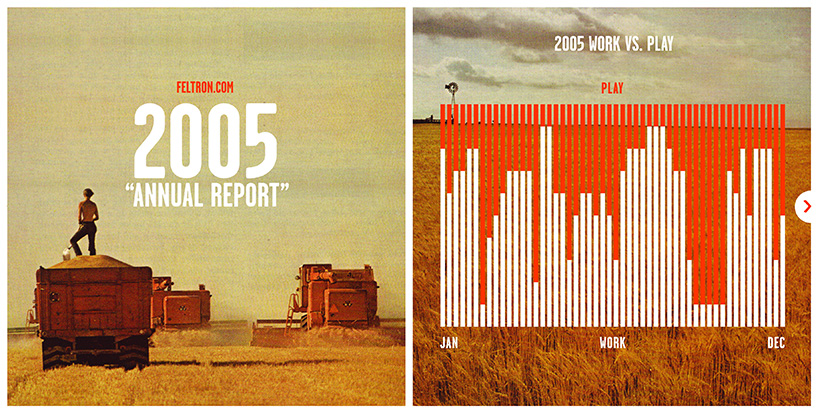
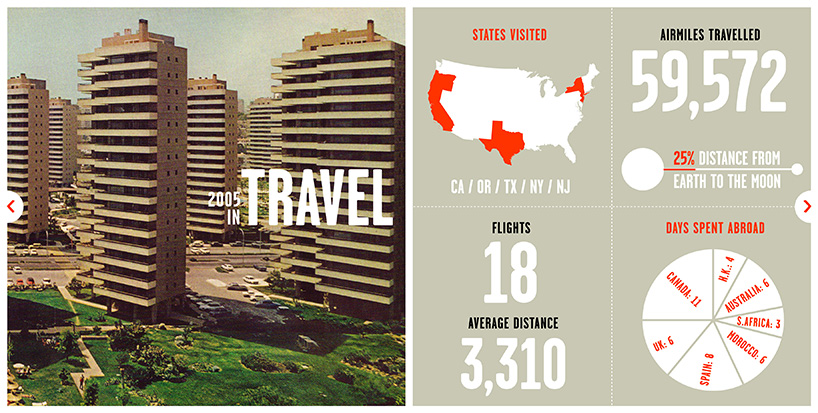
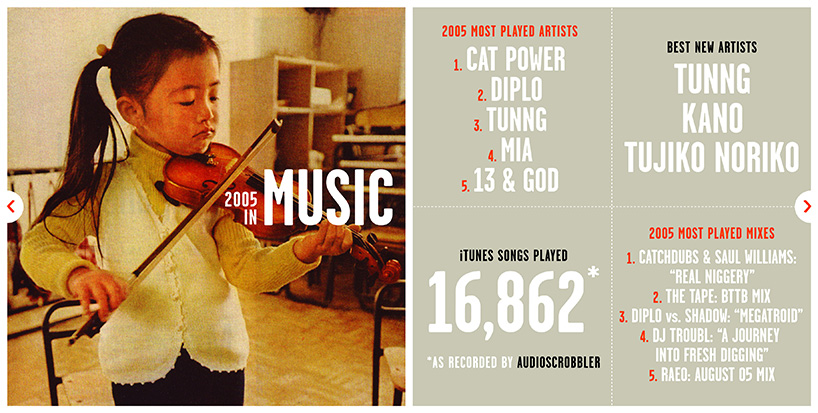
2005 annual feltron report
DB: who has been the biggest single influence on your approach as a designer?
NF: hard to say – there’s been many influences. I did several internships early on in my career, including one with david albertson, which stays in my mind. however, quite early on in my career I decided to work as a freelancer – so it’s been as much about figuring things out and finding my own path as being shown the ropes. around 2003/04 I became fascinated with the use of charts, graphs and diagrams as communication tools and decided to start my first annual report. the positive feedback, came mostly from remote people who contacted me through the internet, and was somewhat overwhelming – that’s been a big motivator for me ever since.
DB: was there a specific project you saw that drew you towards using infographics?
NF: not so much a graphic design project but a combination of the tools that were becoming available around that time and the fact that I always felt I wasn’t good at telling stories in other ways. there’s always been a scientific edge to my personality and design preferences so diagrams and data are a good fit.
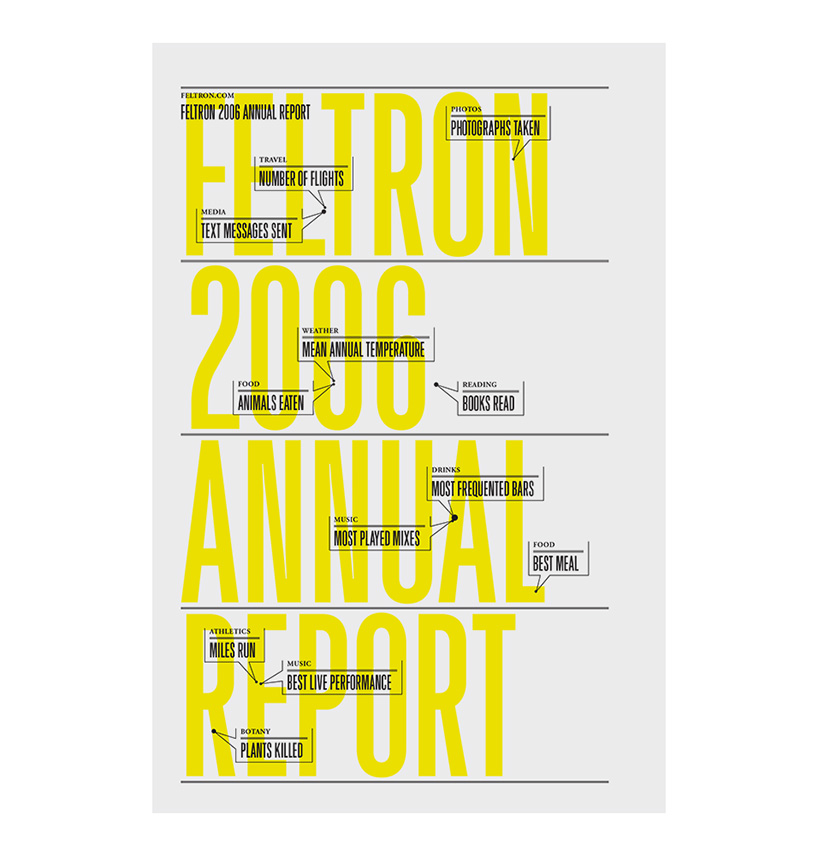
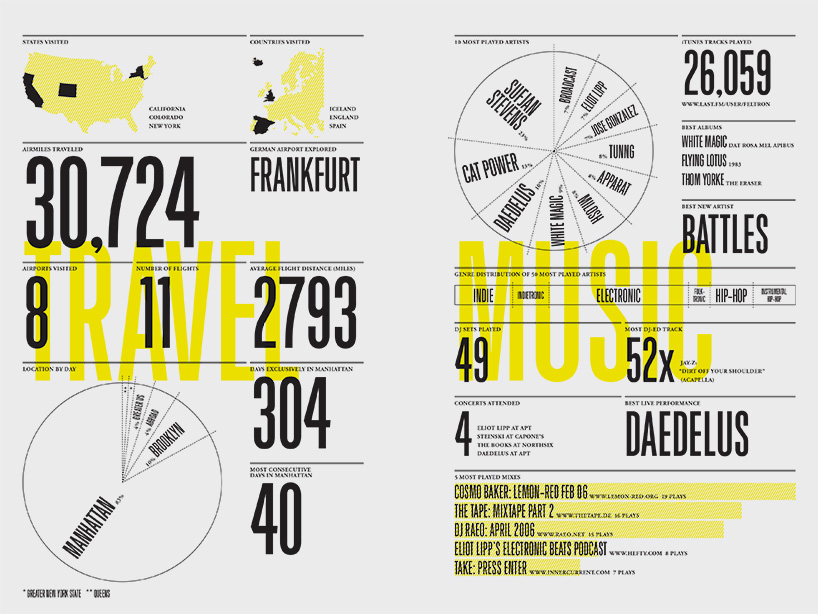
2006 annual feltron report
DB: please could you tell us about the process behind making your reports and how it’s evolved over the years?
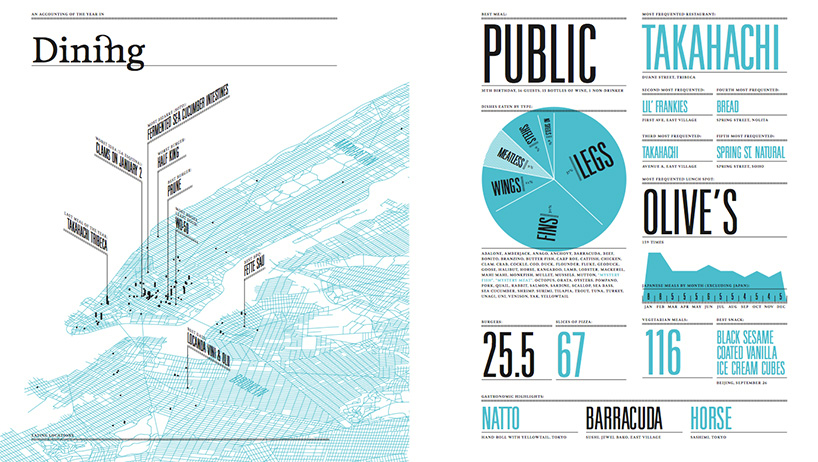
NF: one of the first things that I had at my disposal was last.fm – which tracked all my music listening habits. music has always been an important part of my life and being able to see my listening habits unfold and have them aggregated in one place fascinated me. I wanted more of that, so I’d use my calendar and planner to record information I thought was interesting, the places I ate, where I went and visualize it in a report. the response to the first report inspired me to do another, so I became more purposeful in recording data. the popularity of each subsequent report has prompted me to take an interest in different parts of my life each year in order to keep the reports interesting for myself and the people who are interested in my work. so it’s really about trying to tell the most interesting story I can. the big difference between the latest reports and the first ones is the wealth of tools available to me today, that allow me to record activities and analyze what’s gone on over the year in lots of detail – I think that’s also made for better story-telling.
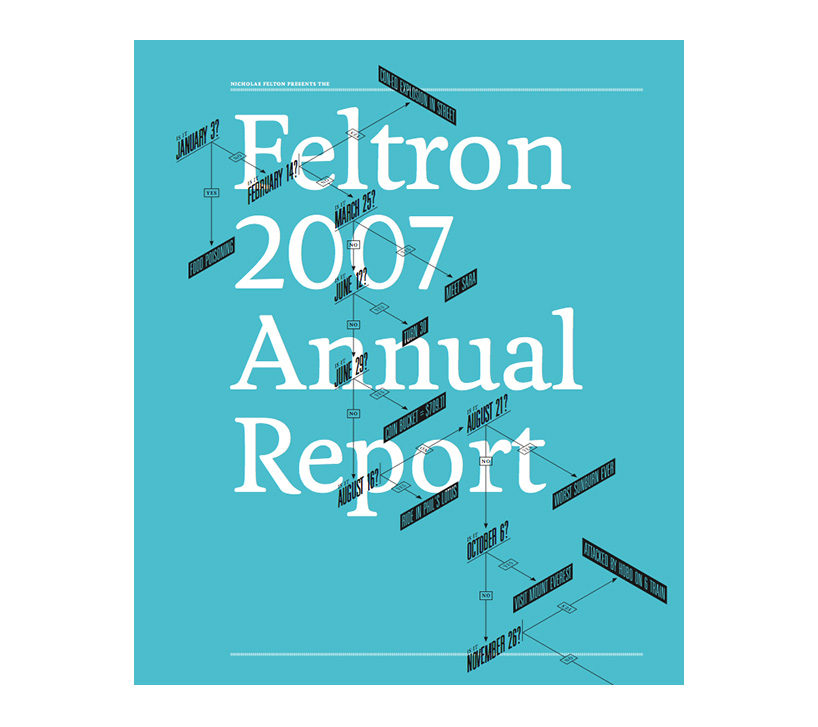
2007 annual feltron report
DB: do you get to know yourself better with each report? is it somewhat therapeutic putting them together?
NF: yes, I’d say so – especially the sense of routine. I don’t know if january is many people’s favorite month but it’s certainly mine, because that’s when I sit down and review everything that’s happened in the last year in terms of events and numbers and also decide on the processes and methods I’ll use for the year ahead. I enjoy the rhythm that the reports have brought to my life.
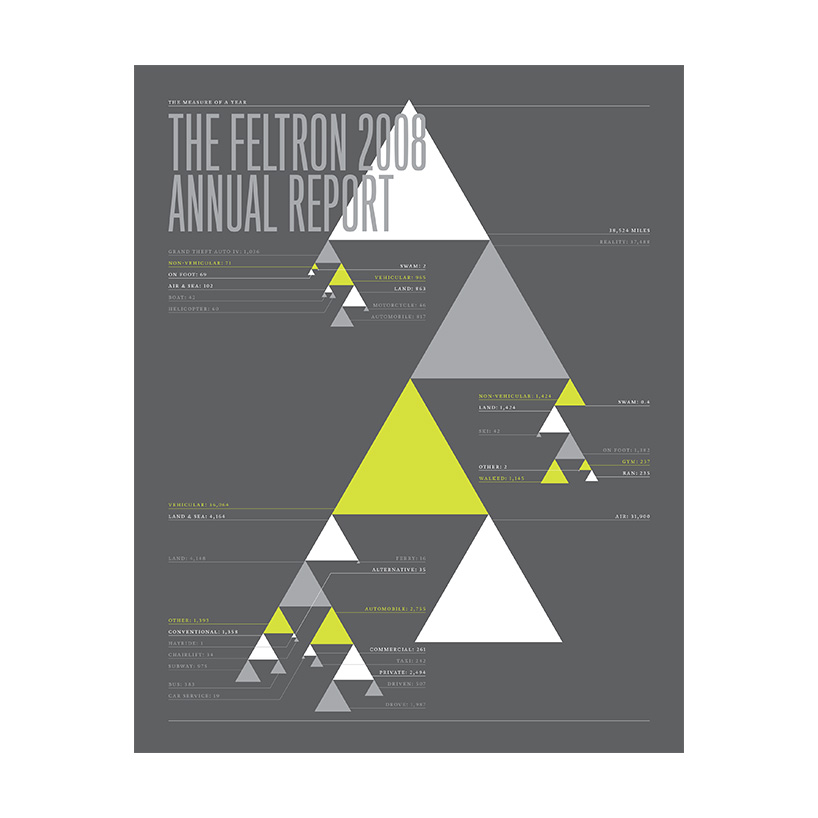
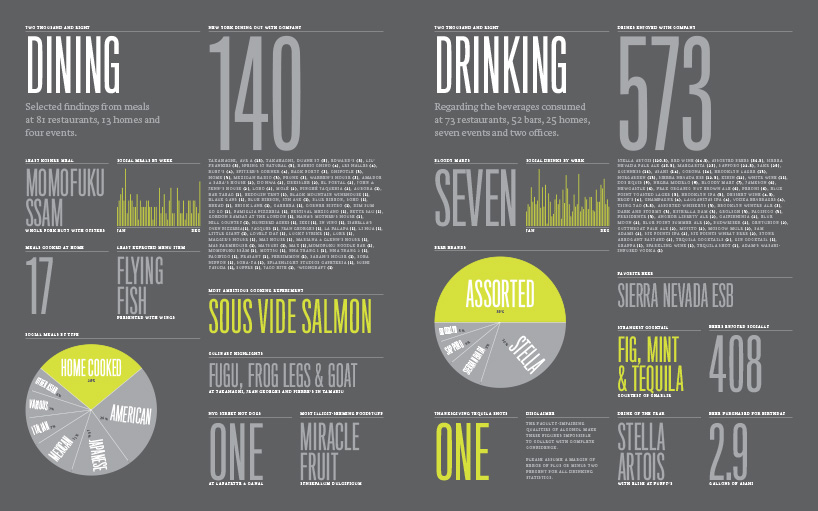
2008 annual feltron report
DB: have the reports made you change any of your day to day habits?
NF: not really, I try to think of them as a travel log for the most part. each year is what it is – maybe one year will be similar to the previous one and maybe it won’t – the idea is simply to record things as they unfold and then tell that story. surprises come out of it – such as knowing exact things, like the number of cups of coffee I drank in a year or the number of miles I traveled. it’s nice for me to see how the pace of my life changes from one year to the next and if fulfillment is connected to that in someway: am I moving to fast? should I be spending more time in one place? what makes me feel happier come the end of the year?
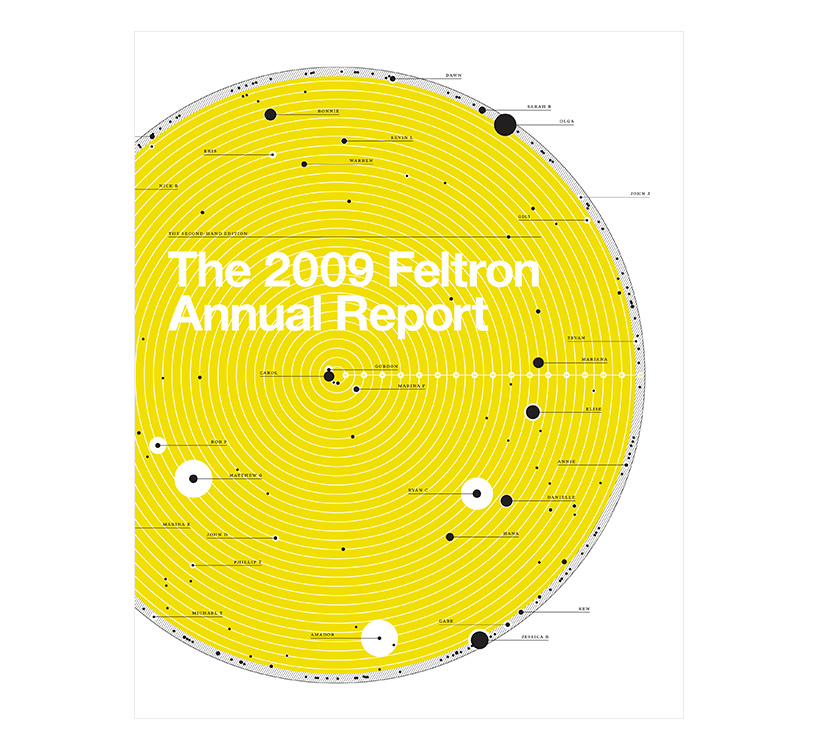
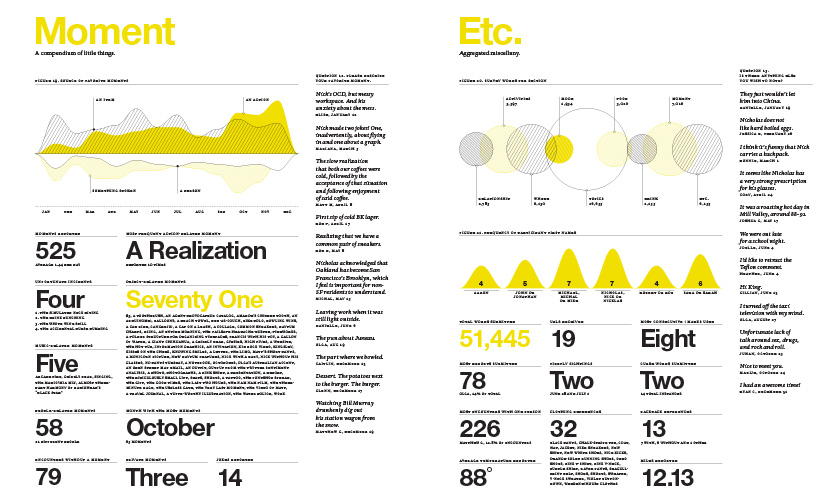
2009 annual feltron report
DB: which has been your favorite report to date?
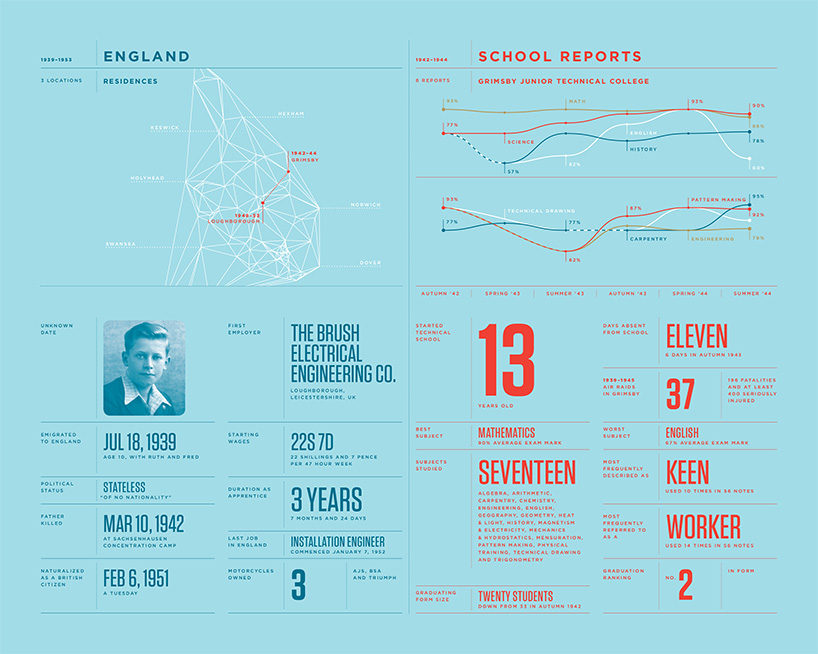
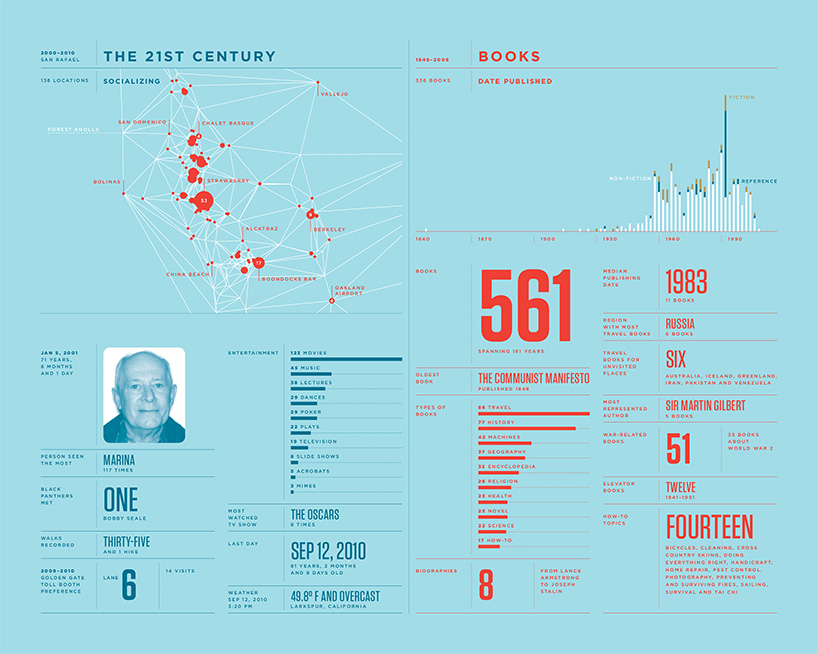
NF: I like all of them in different ways but perhaps the one that is most special to me is the one from 2010 – about my father’s life. in 2010 my father passed away so that year’s annual report is an encapsulation of my his life, made from all the he calendars, slides and other artifacts of his that I have in my possession.
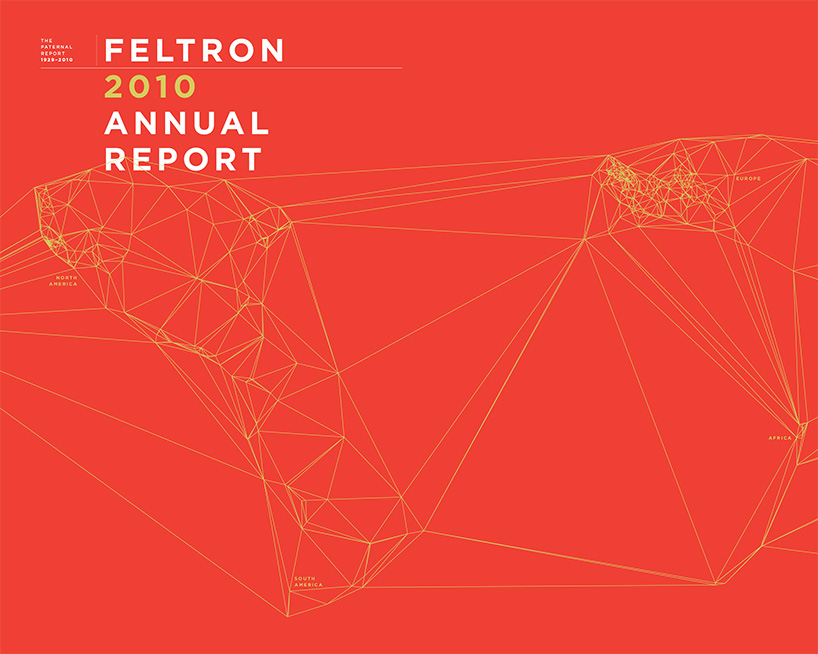
2010 annual feltron report
DB: what would you like to achieve with the next report?
NF: the next one will be the last sequential one – as it will mark ten years of doing this ‘type’ of report. when I started this project there were very few tools to record your habits but now that’s not the case – the cool thing is that now anyone can capture information regarding all aspects of their lives through various platforms and that should continue with wearable devices and mobile apps. so, what I’m looking to do after the next one will be to continue with a year-long self initiated project but not necessarily a report.
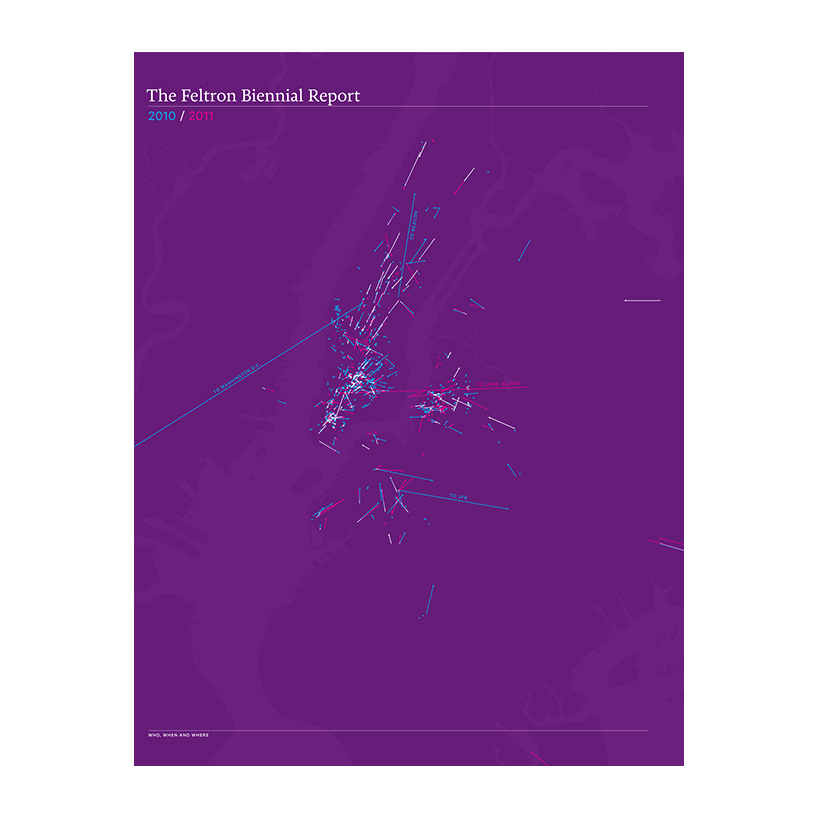
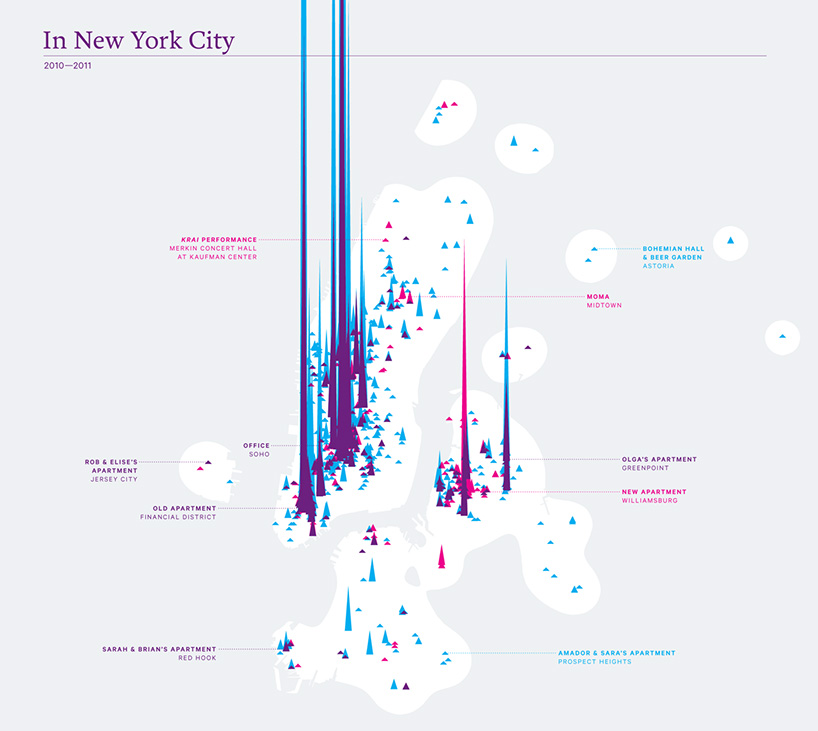
2011 annual feltron report
DB: where do you look to in terms of inspiration for the visuals of your reports, colors forms and so on?
NF: I look to a lot of the artists who work with code and interaction design. science and nature are always good places to start for color and forms. in terms of design I’m still fascinated by the golden age of modernism. I’m always flattered when people compliment me on the colors I’ve used because that’s something I usually battle with right up to the last day of the reports. in terms of where I look for color references, it’s anywhere – paintings, other design work… it’s mostly a question of how the ratio of color to color works for me – that’s very important because those relationships make a big difference on how you perceive a diagram. forms, colors and typography have to work together to achieve a balance, and communicate what you want to say.
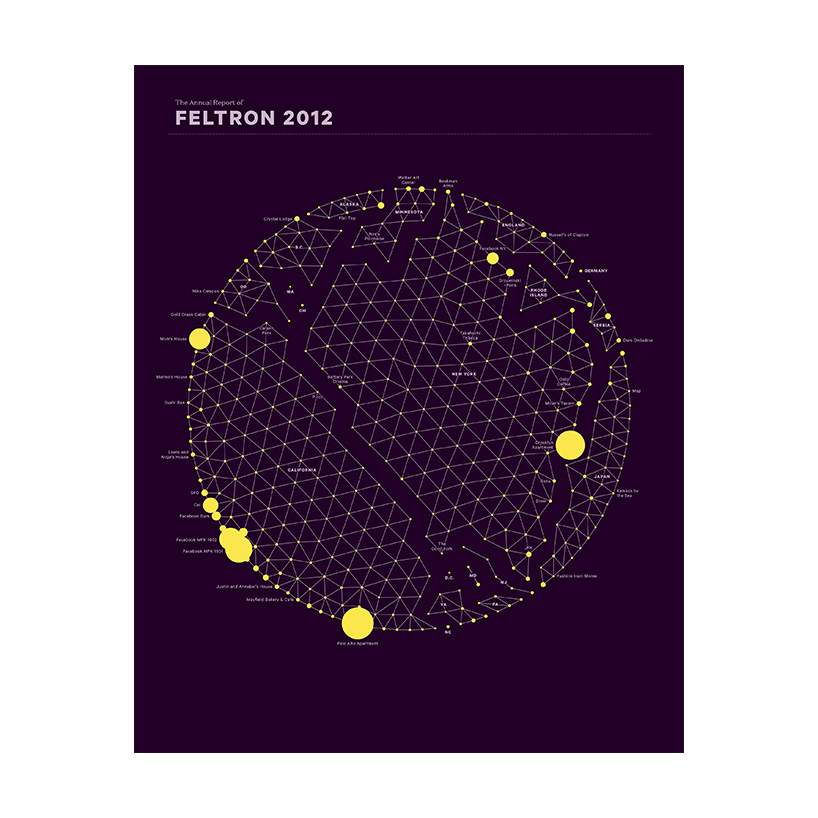
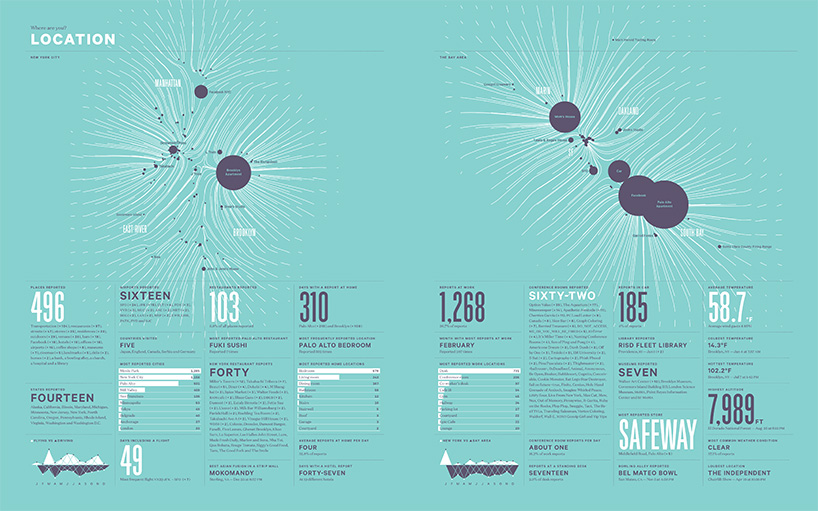
2012 annual feltron report
DB: how has your work on these personal reports influenced the commissioned work you undertake?
NF: in a big way! they’ve defined almost all the products and projects I’ve worked on over the last seven years. starting with daytum, which I worked on with ryan case – daytum allows you to count and communicate various types of information about yourself. that lead directly to us working with facebook on the timeline, and making it more representable of people’s habits. after that I worked on reporter, an iPhone application that carried out randomly timed surveys each day. now I’m working on another app that should be out in the new year, the name isn’t defined yet. I also want to combine all of the reports into a book and include some meta-analysis of some things that have been tracked over more than one year.
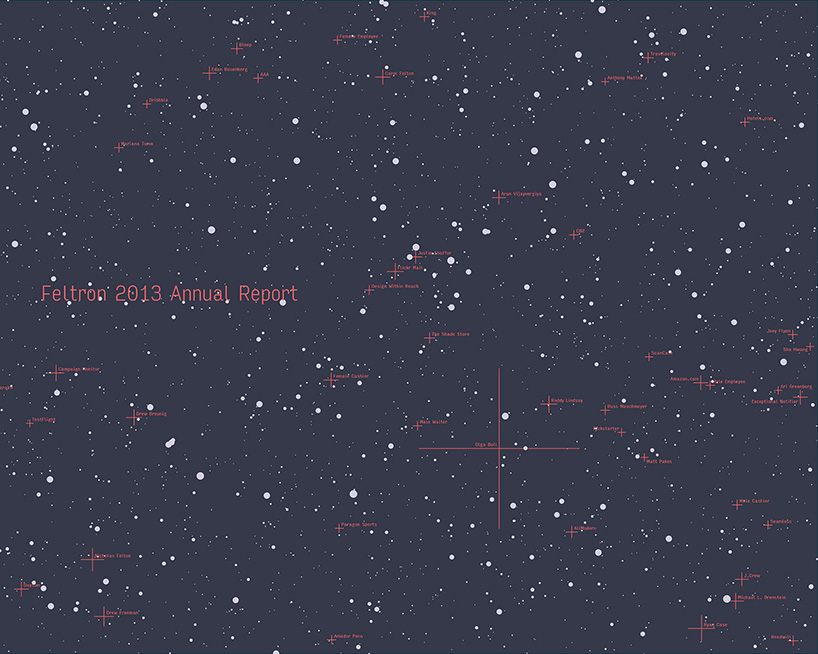
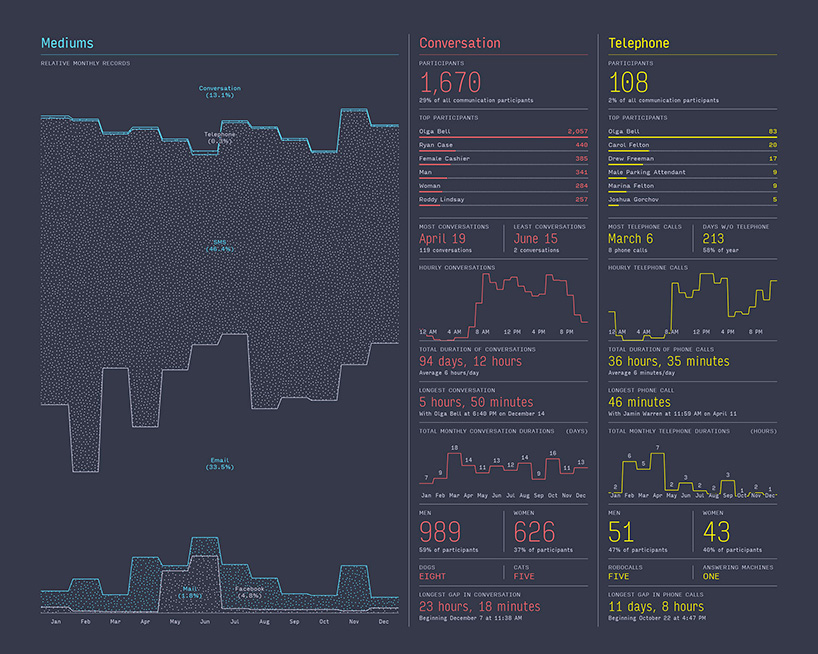
2013 annual feltron report – available here
DB: what advice do you have for young designers?
NF: work hard. you have to put the hours in no matter what you do. that’s the only way you’ll get better and achieve the things you want to achieve.
DB: what’s your motto?
NF: keep it simple.
GRAPHIC STUDIO INTERVIEWS (193)
 Nov 21, 2022
 Feb 10, 2019
 Jun 21, 2018
 May 17, 2018
 Oct 04, 2017
INFOGRAPHICS (19)
 Aug 06, 2020
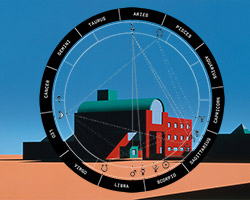 May 02, 2019
 May 07, 2018
 Apr 10, 2016
 Sep 08, 2015
PRODUCT LIBRARY
 Apr 17, 2024
 Apr 15, 2024
 Apr 15, 2024
 Apr 12, 2024