kim albrecht works as an interface design researcher in a physics lab at the center for complex network research. his work asks the basic question: ‘how can design help us to understand the world surrounding us?’ for albrecht, design in this sense is not about decoration or communication, but rather acts as a tool to create insights and knowledge. his most recent project sees him visualize the scientist’s path to success using an interactive graph of data that questions the correlation between career, ability, achievements and lasting scientific impact.
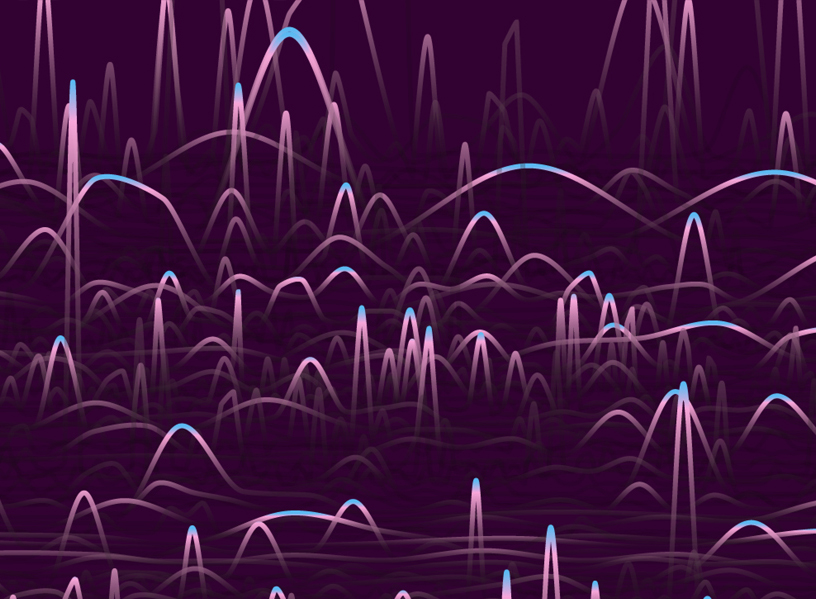
the project visualizes the randomness of success in science
albrecht’s project — created in collaboration with roberta sinatra and laszlo barabasi — is entitled ‘the science of success’, and was featured recently in the journal ‘science’. visualizing the randomness of significant scientific achievements, the interface allows you to explore 10,000 careers spanning seven different disciplines: physics, ecology, economics, neuroscience, chemistry, biology and cognitive sciences.
‘over the last five years, my work has become influenced by the idea of design as ‘drawing things together’. a connection between art, science, and technology,’ explains kim albrecht. ‘before the renaissance, art and science were not seen as two separate disciplines. today they co-exist in our cultural realm but intersect only seldom. I am trying to bring these disciplines closer together through the artifacts I create. my work is done collaboratively with scientists. once created, they become boundary objects reaching various audiences.’
albrecht sees design as less about decoration or communication, but rather as a tool to create insight
clicking anywhere on the histogram filters the scientists according to a number of criteria: their average citations after ten years, their ‘individual Q’ or ability to consistently produce high impact papers, the number of papers they have produced, and their ‘H-index’ — a scientist has index ‘H’ if they have ‘H’ papers with ‘H’ citations. the result? the highest-impact work has the same probability of falling anywhere in the sequence of papers published by a scientist. it could be the first publication, appear mid-career, or emerge last. this result is known as the ‘random impact’ rule, and can be observed throughout the graph’s beautifully realized data. no matter discipline, rank or prolificness: impact peaks are career-wide, occurring whenever and wherever inspiration hits.
designboom has received this project from our ‘DIY submissions‘ feature, where we welcome our readers to submit their own work for publication. see more project submissions from our readers here.
edited by: peter corboy | designboom
DATA VISUALIZATION (7)
 May 08, 2023
 Jan 27, 2023
 Jul 29, 2022
 Jul 06, 2021
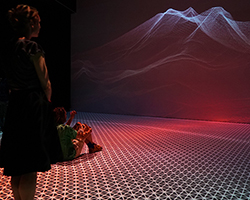 Nov 08, 2016
PRODUCT LIBRARY
 Apr 15, 2024
 Apr 15, 2024
 Apr 12, 2024
 Apr 04, 2024