
3D printed infographics by coming soon relay statistical data with playful plastic pieces
all images courtesy of coming soon
belgian creative studio coming soon has 3D printed a set of information graphics for the annual report of biopharmaceutical company ablynx. the series of eight illustrations blends physical printed components with digital graphics and typography. each of the compositions describe a sequence of performance, operating, or income statistics through a playful yet explanatory visual system. colorful 3D printed forms have been made in the shape of pie charts, line, and bar graphs, with accompanying text delineating the collected data and exact figures. each of the plastic pieces have been carefully constructed and configured to correlate to existing statistical information sourced from the company. the final stages of the compositions include the addition of miniature figures, which have been made to interact with the diagrams — climbing on, swinging from and walking through the plastic pieces.
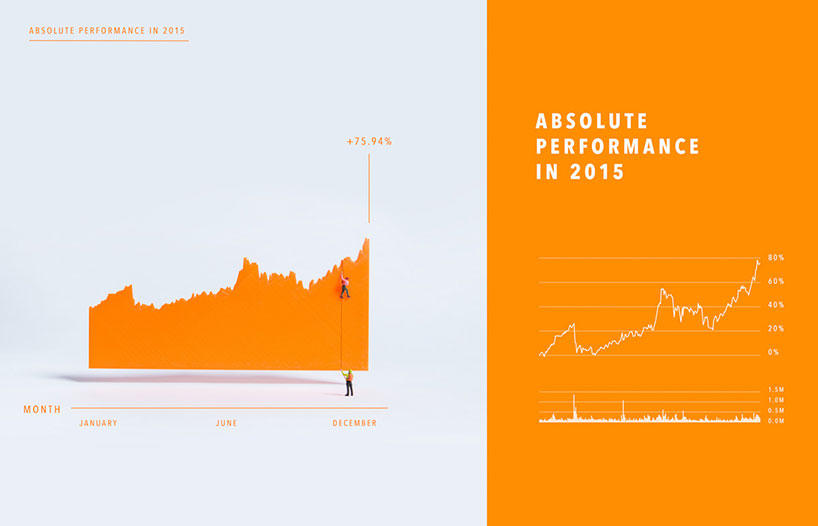
the spread illustrates the company’s overall performance through tiny figures that scale an orange mountain

3D printed green, blue and yellow pieces are made into a bar and line graph
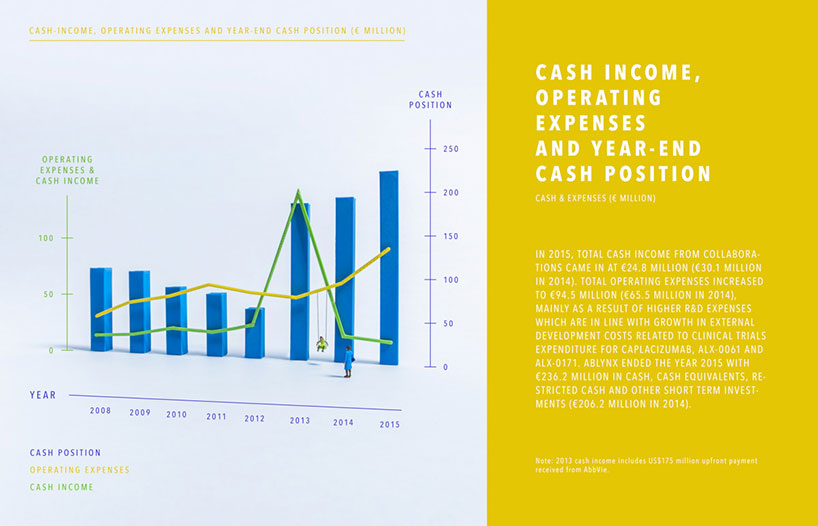
the image indicates cash and expenses through a colorful bar and line graph

an abstract pie chart features a small figure hanging from a 3D printed circle
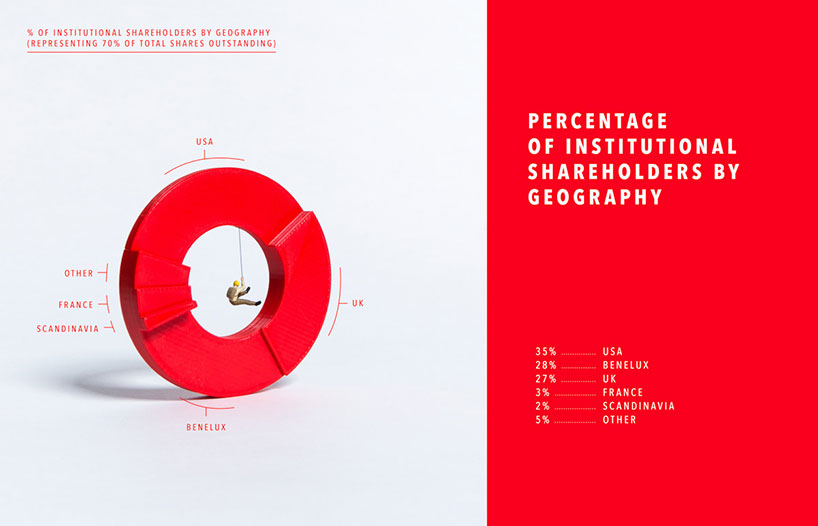
the spread describes the geography of the company’s shareholders

tiny figures walk through a sequence of three-dimensional blue lines

the spread conveys data about the number of products in the clinic according to year

two figures scale a series of green line graphs
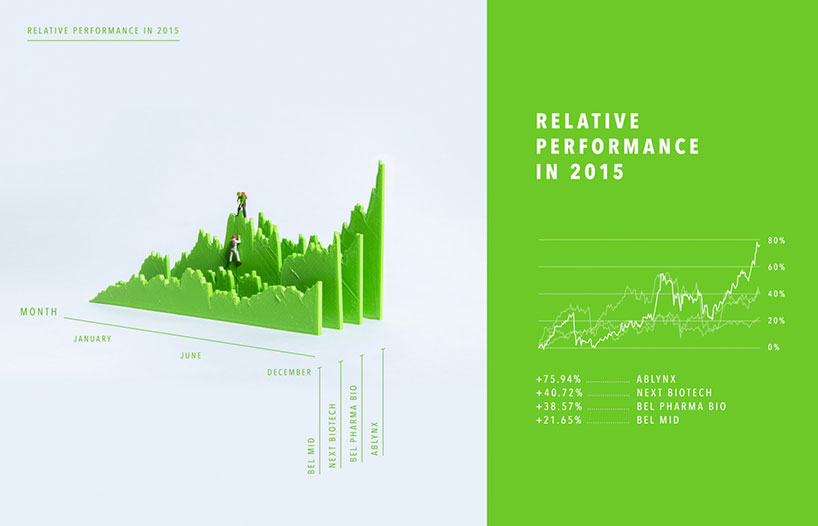
the spread illustrates the brand’s performance in relation to its competitors

an extruded pie chart shows segments of data as figures ascend a spiral staircase
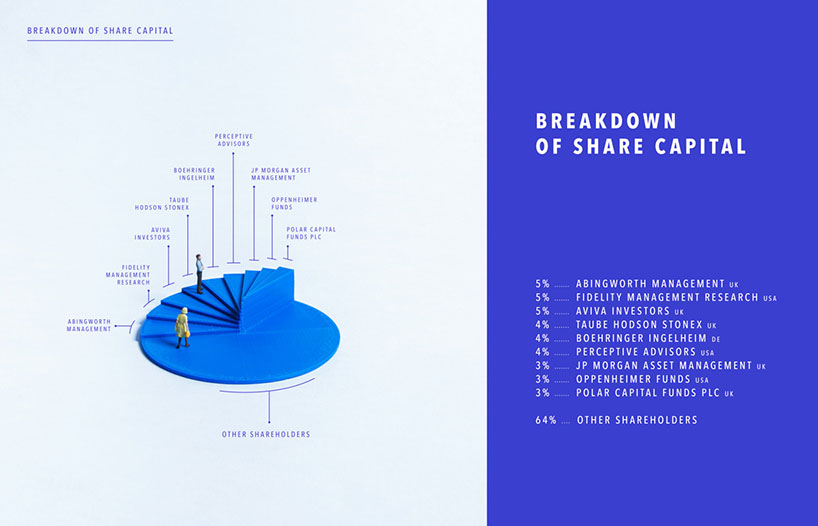
the composition documents the breakdown of share capital

a single climber makes his way up an ascending yellow line
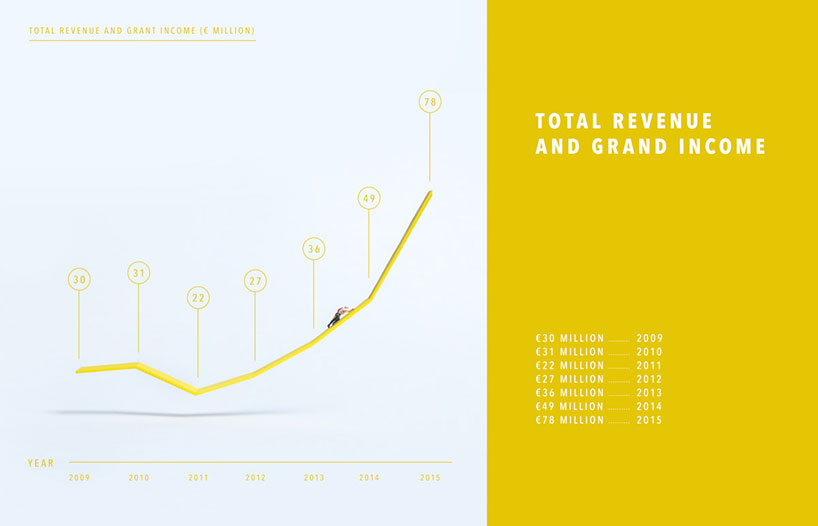
the spread shows the total revenue and grand income

figures climb up a ladder to reach the upper parts of the bar graph
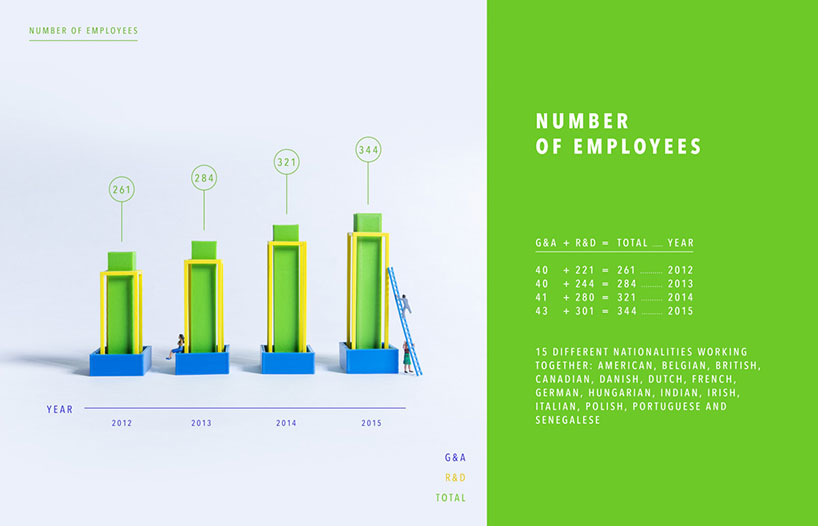
the spread shows the number of employees over the last four years

individually 3D printed parts have been assembled into infographics

the pieces have been carefully constructed to correlate to data
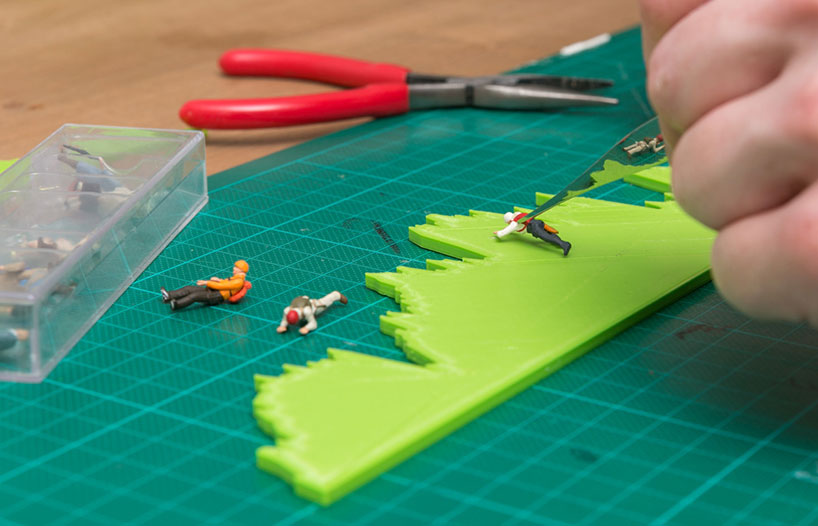
small figures are added to the informational scenes

a figure is attached to a 3D printed pie chart
3D printing (766)
 Jul 22, 2024
 Jul 20, 2024
 Jul 13, 2024
 Jul 02, 2024
 Jun 26, 2024
infographics (19)
 Aug 06, 2020
 May 02, 2019
 May 07, 2018
 Sep 08, 2015
 Nov 05, 2014
PRODUCT LIBRARY
 Jul 23, 2024
 Jul 01, 2024
 Jun 13, 2024
 Jun 06, 2024