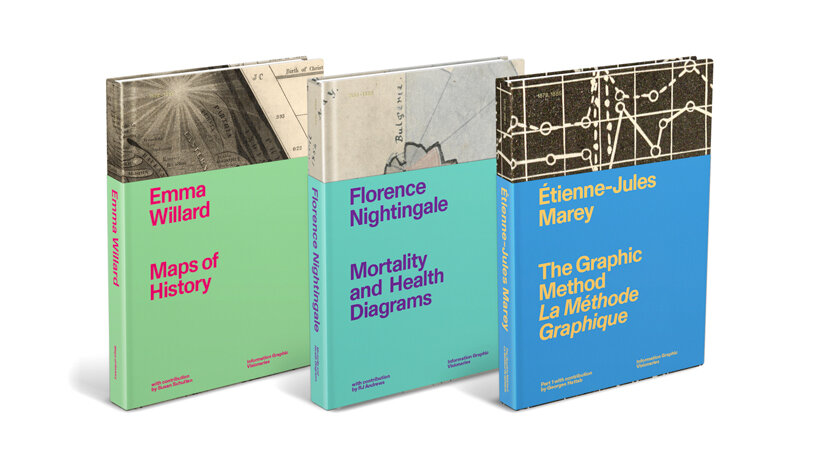
nowadays, data visualization and infographics are the go-to tools to communicate complex information and statistics. but where did these methods originate? and who were the pioneers behind them? well, a new trio of books titled information graphic visionaries delves into the history of information graphics and shines a light on three principal figures: florence nightingale, emma willard and étienne-jules marey. from nightingale’s innovative medical diagrams to willard’s stunning timelines, each book compiles a visual catalog of essays and never-before-seen images.
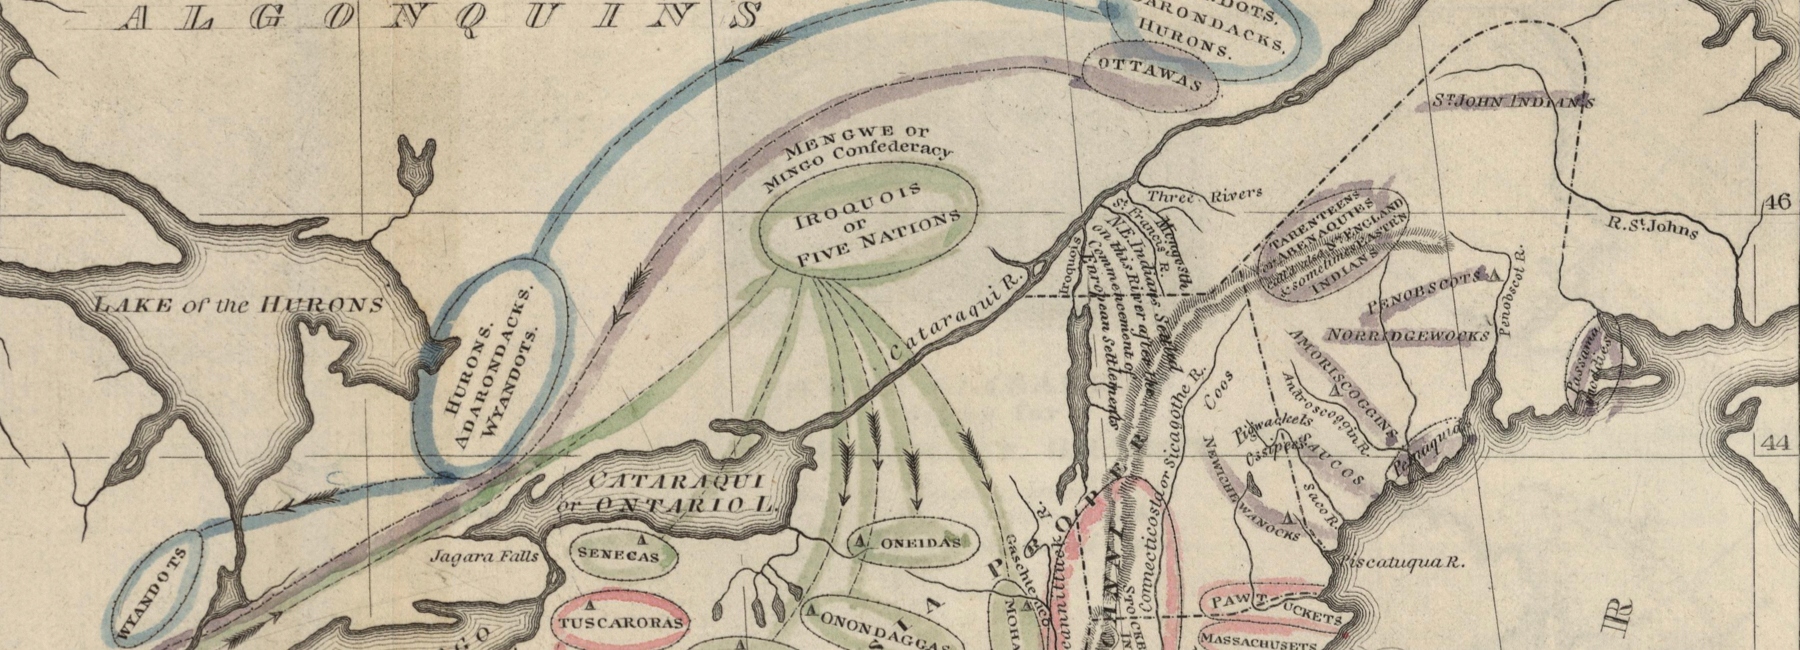
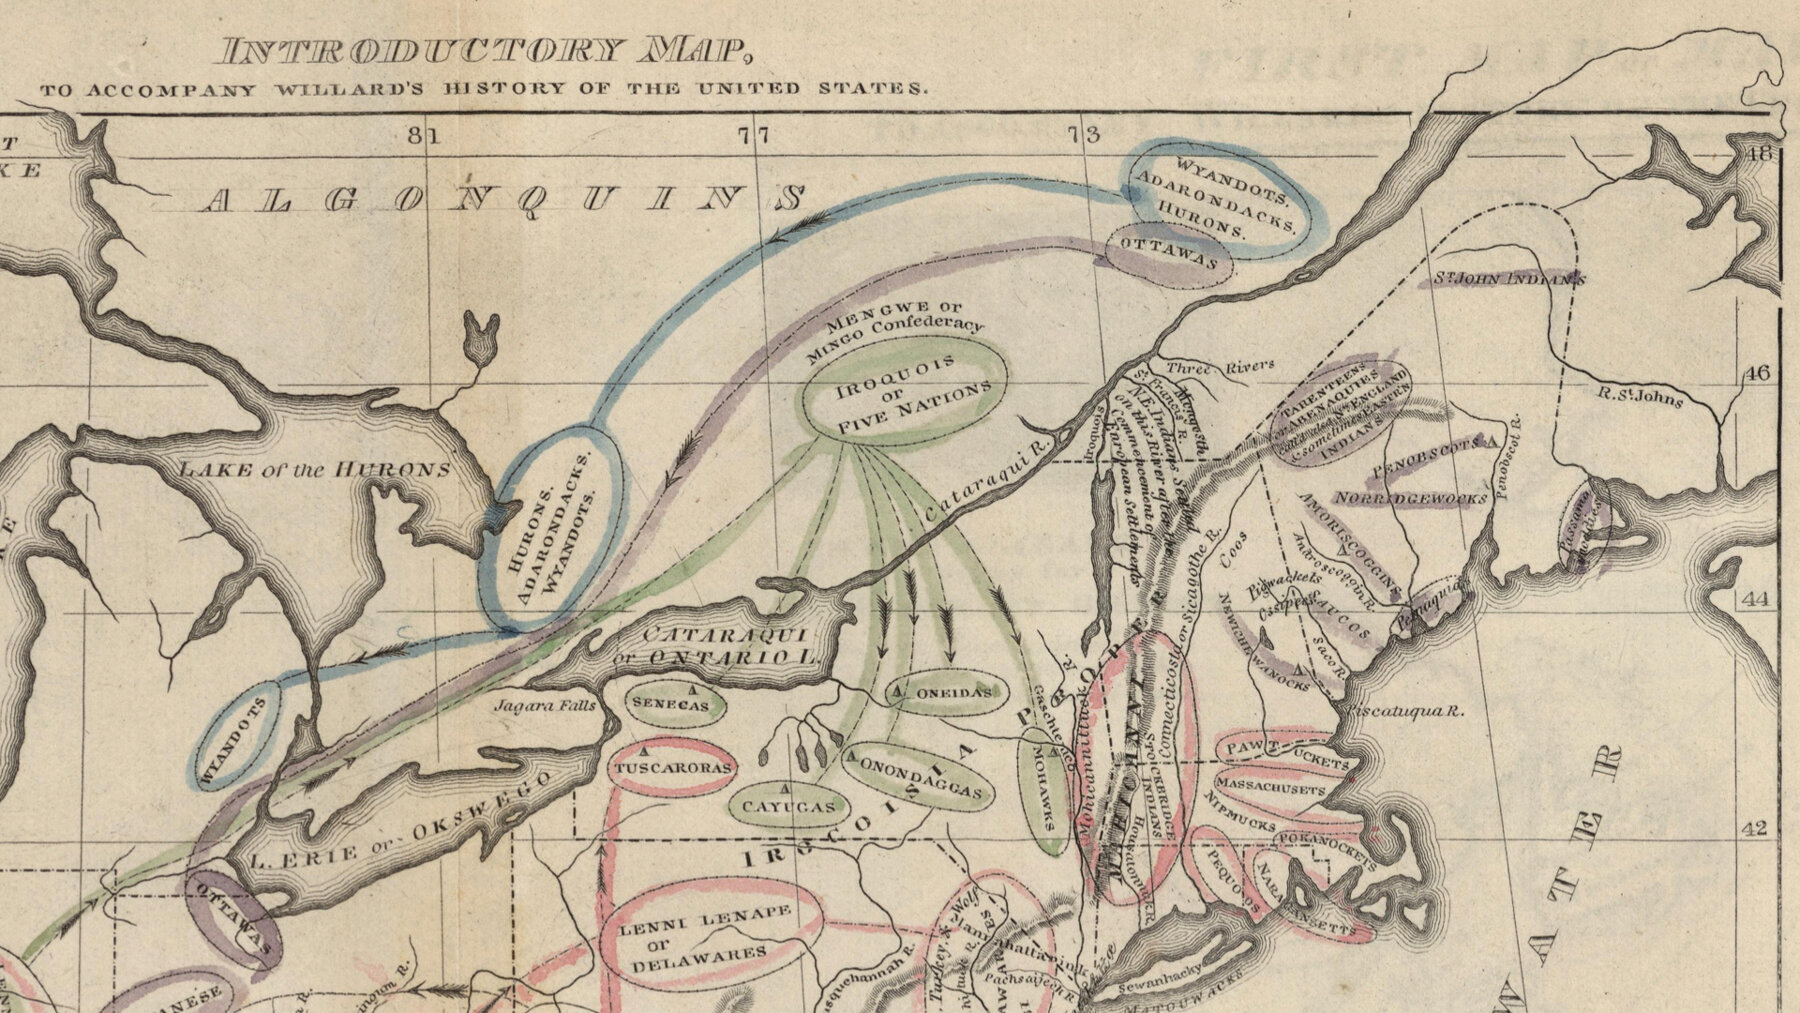
(main image emma willard, introductory map detail)
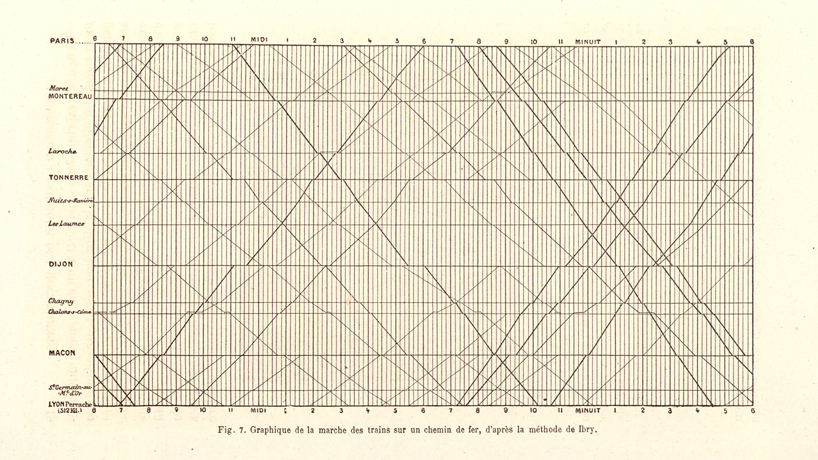
all images courtesy of information graphic visionaries
emma willard created new ways to understand and depict time, her inventions defined chronology for millions of americans. florence nightingale’s data stories persuaded royals and generals to adopt health reforms, preventing thousands of needless deaths. étienne-jules marey revealed to the human eye what it cannot naturally see; changing not only science but cinema and art too. his poetic book, titled the graphic method (la méthode graphique), was the first about data graphics and has inspired insiders for over a century. it has never been translated to english, until now.
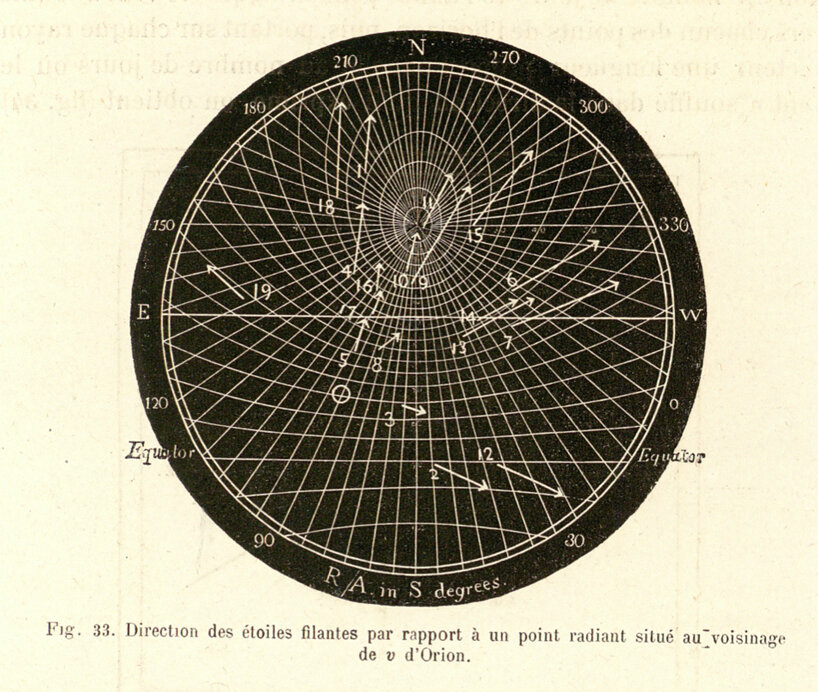
étienne-jules marey, direction of shooting stars
the international team compiled these exhaustive compositions by researching collections around the world, establishing complete visual catalogs of work from letters, sketches and edits through to completed work, discovered new materials and found long-lost graphics. archival photography has allowed the reproduction of these findings to be printed to scale, revealing details often overlooked and celebrating the works of these three revolutionary creators.
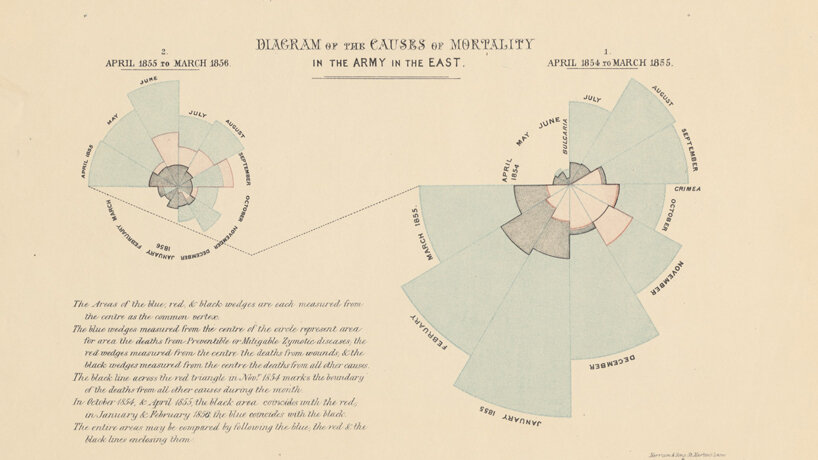
florence nightingale, diagram of the causes of mortality
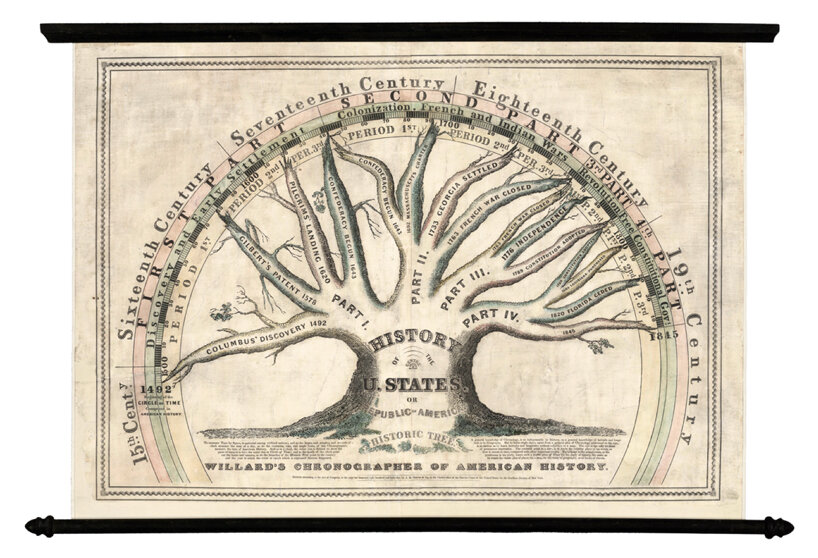
emma willard, chronographer of american history
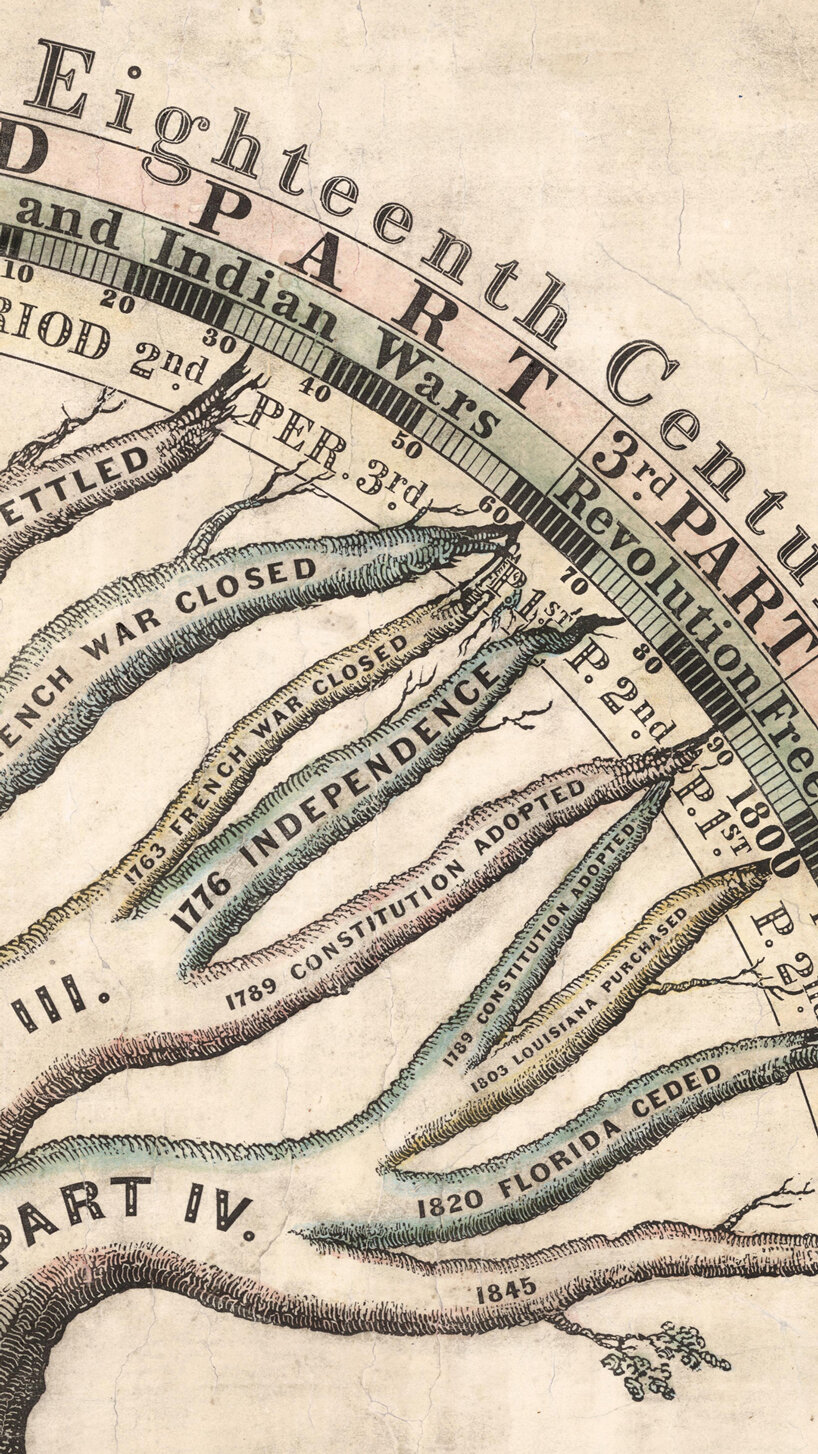
emma willard, chronographer of american history
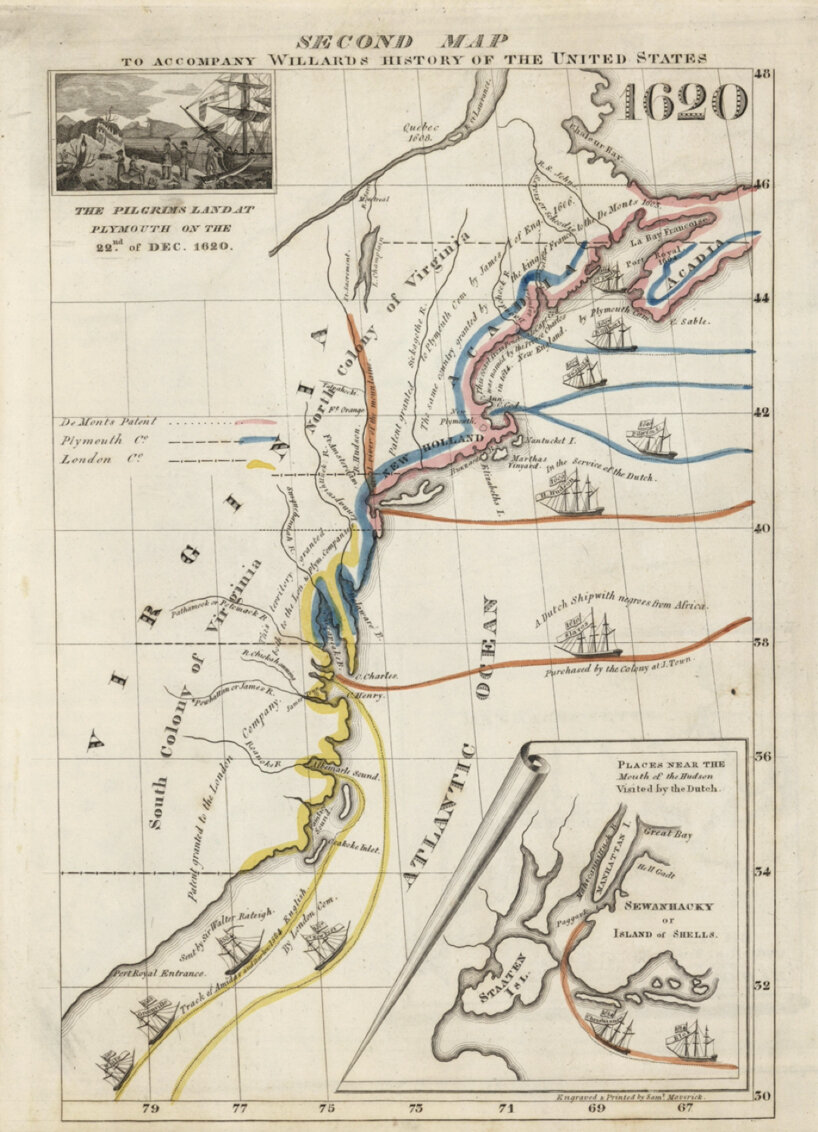
emma willard, map of 1620
emma willard, map of 1620 detail
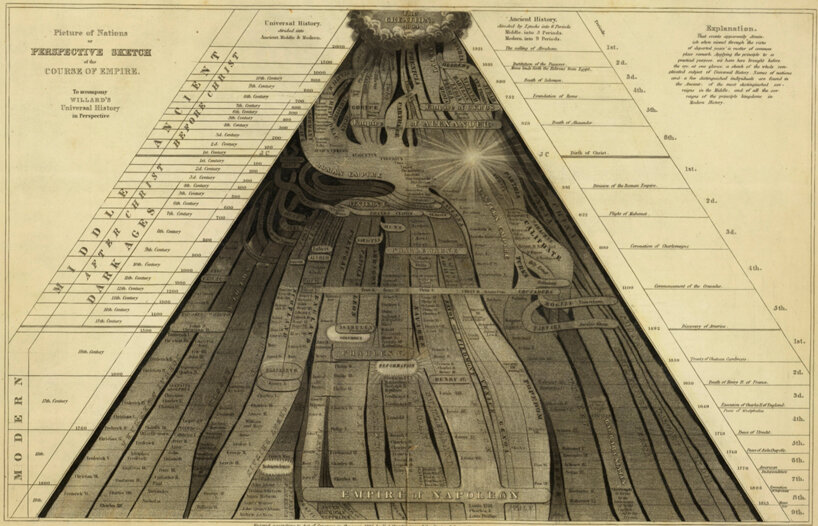
emma willard, perspective sketch
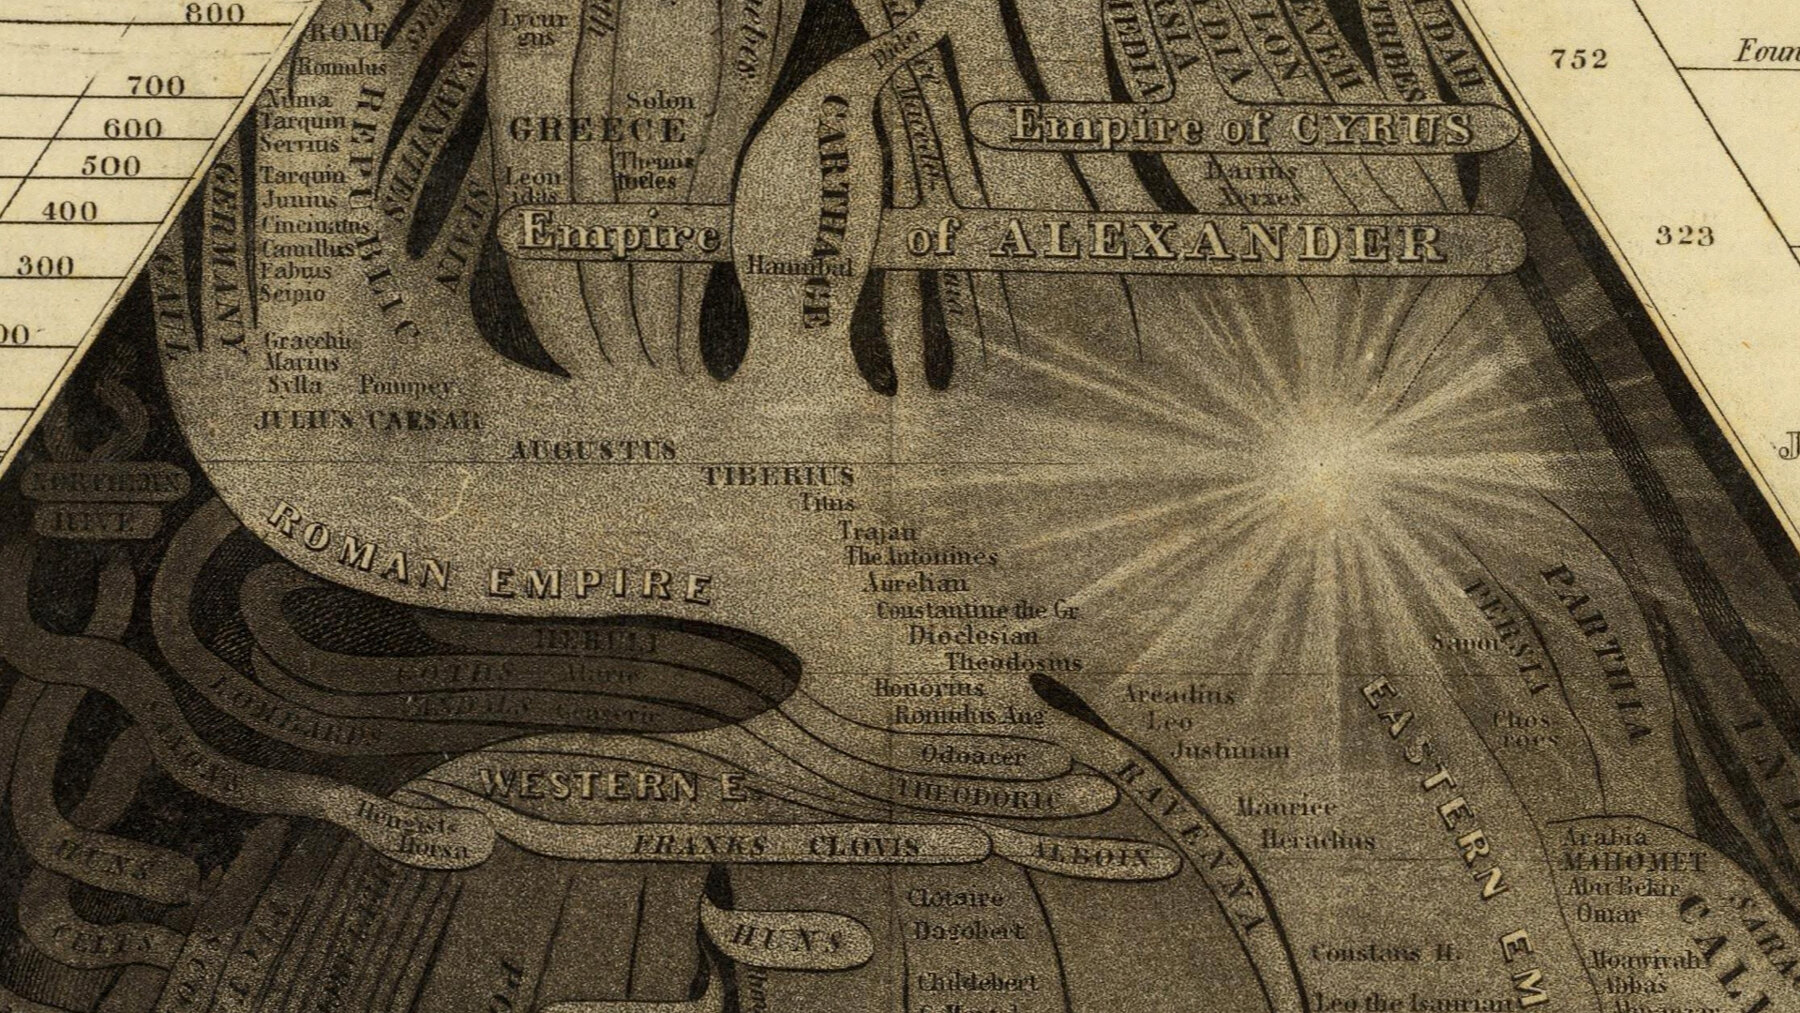
emma willard, perspective sketch detail
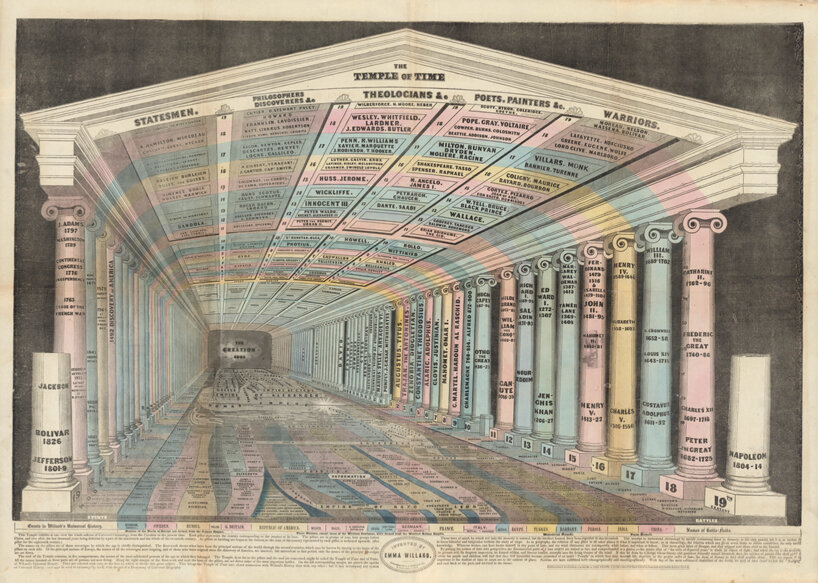
emma willard, temple of time
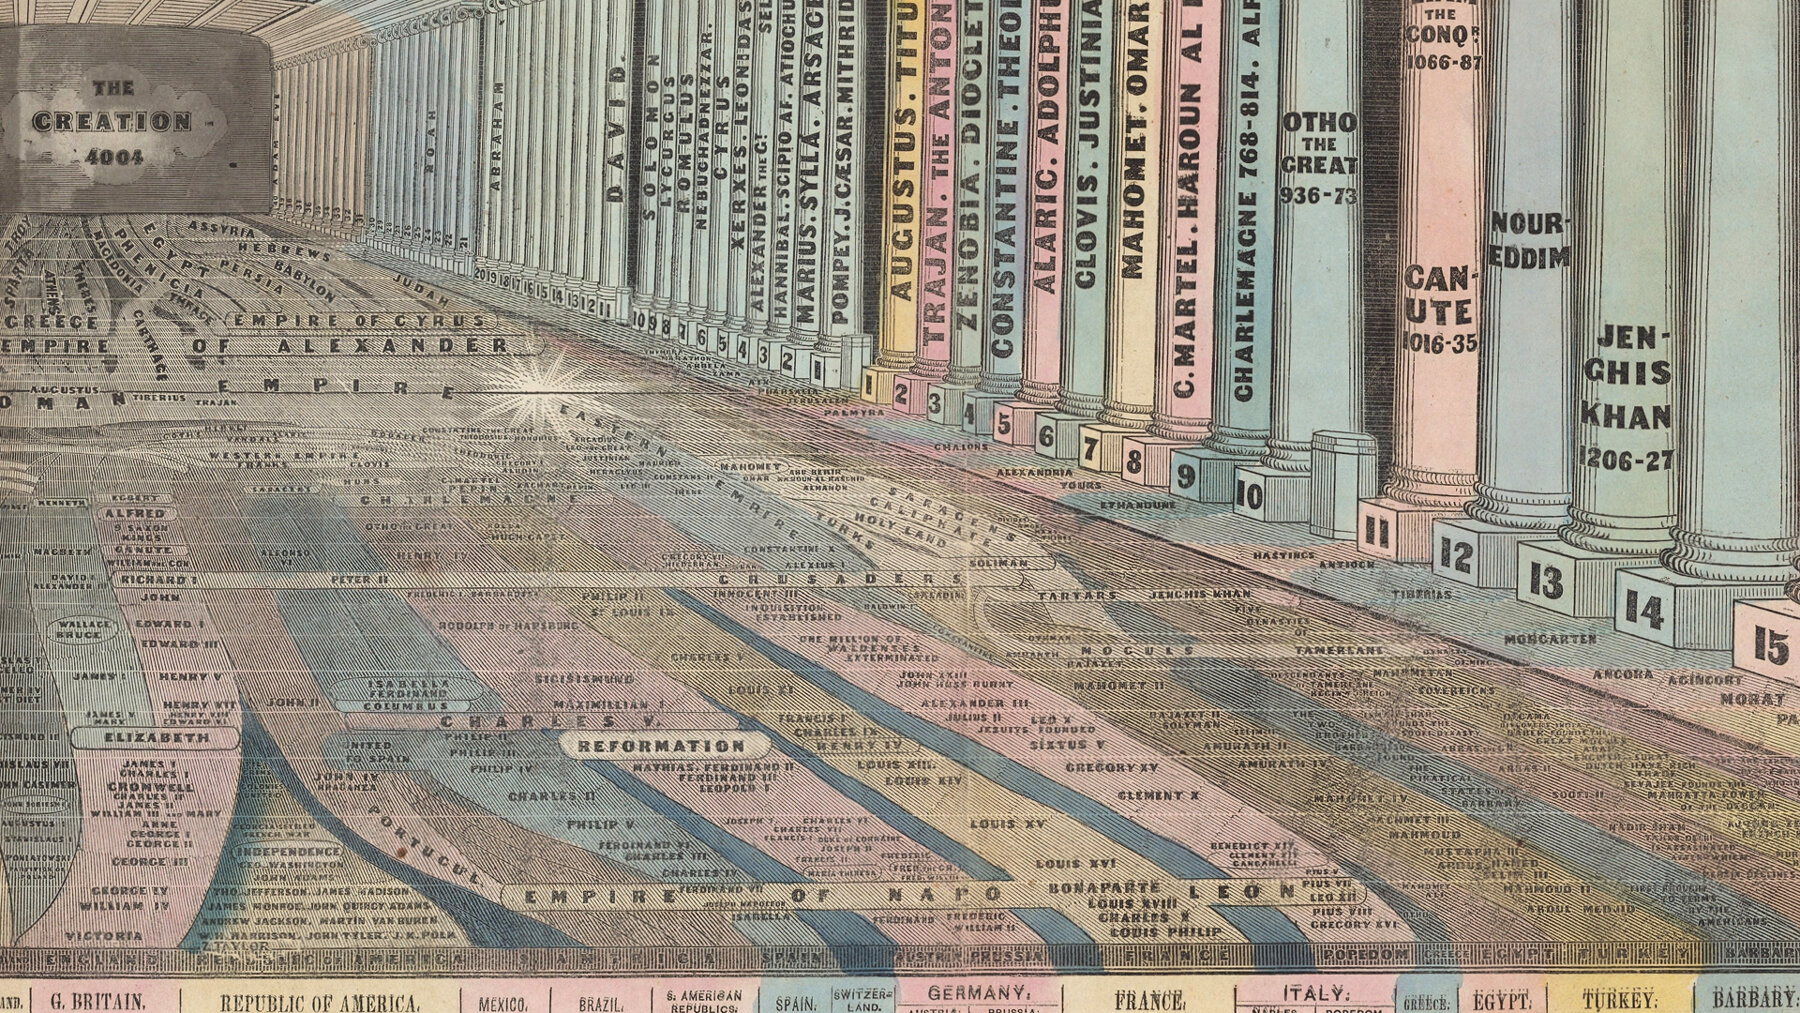
emma willard, temple of time detail


book info:
titles: information graphic visionaries: emma willard: maps of history, florence nightingale: mortality & health diagrams, and étienne-jules marey: the graphic method, la méthode graphique
edited by: RJ andrews
images from: emma willard: maps of history, florence nightingale: mortality & health diagrams, or étienne-jules marey: the graphic method, la méthode graphique
designboom has received this project from our ‘DIY submissions‘ feature, where we welcome our readers to submit their own work for publication. see more project submissions from our readers here.
edited by: lynne myers | designboom
designboom book reports (197)
 Jul 12, 2024
 Jun 30, 2024
 Jun 17, 2024
 Jun 01, 2024
 May 29, 2024
PRODUCT LIBRARY
 Jul 23, 2024
 Jul 01, 2024
 Jun 13, 2024
 Jun 06, 2024