'data is not neutral': federica fragapane's soft forms visualize hard facts on inequalities
the italian information designer explains how her triennale milano installation transforms hard facts into empathetic, organic forms.

10 stories
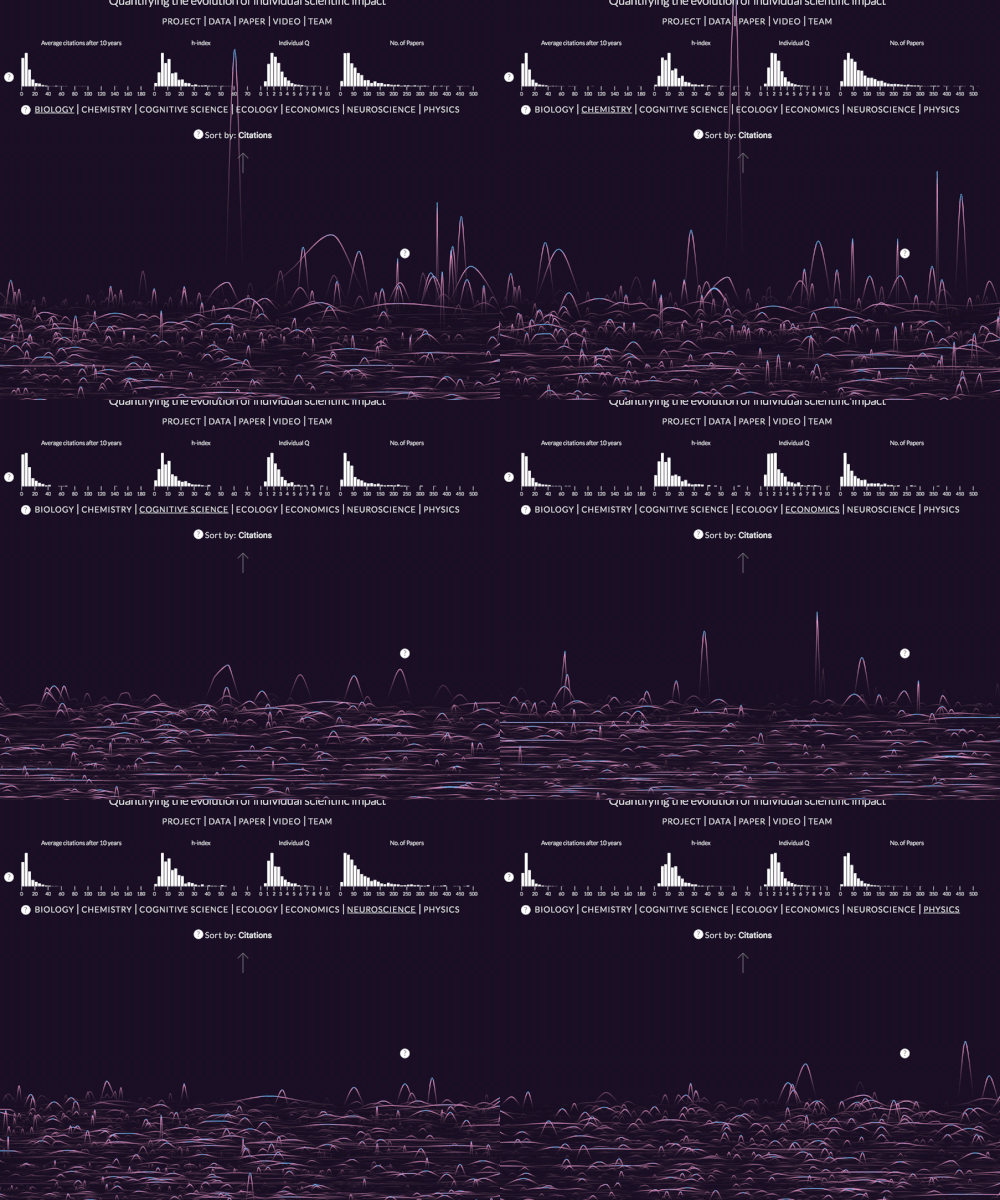
data visualization refers to the techniques used to communicate data or information by encoding it as visual objects (e.g., points, lines or bars) contained in graphics. the goal is to communicate information clearly and efficiently to users, often creatively manipulating data into more artistic representations.
[FEATURED]
the italian information designer explains how her triennale milano installation transforms hard facts into empathetic, organic forms.
your own online design shop — no sales commission collected









 2027 French Design Awards deadline: april 6th, 2027
 New York High Falls Riverfront Market $ 10,000.00 USD deadline: january 18th, 2027
 Call for Entries: UX Design Awards - Spring 2027 deadline: november 15th, 2026
 2026 London Design Awards Season 2 deadline: december 17th, 2026
 International Furniture Design Competition Asahikawa [IFDA] deadline: december 11th, 2026
 The Architect’s Chair Stockholm Furniture Fair Edition $ 9,120.00 USD deadline: january 5th, 2027
 Vancouver Tall Challenge $ 15,000.00 USD deadline: november 30th, 2026
 2026 TITAN Property Awards Season 2 deadline: november 5th, 2026
 Buildner’s Unbuilt Award 2026 $ 115,875.00 USD deadline: october 20th, 2026
 Valli Wine Tasting Room $ 11,632.00 USD deadline: february 15th, 2027