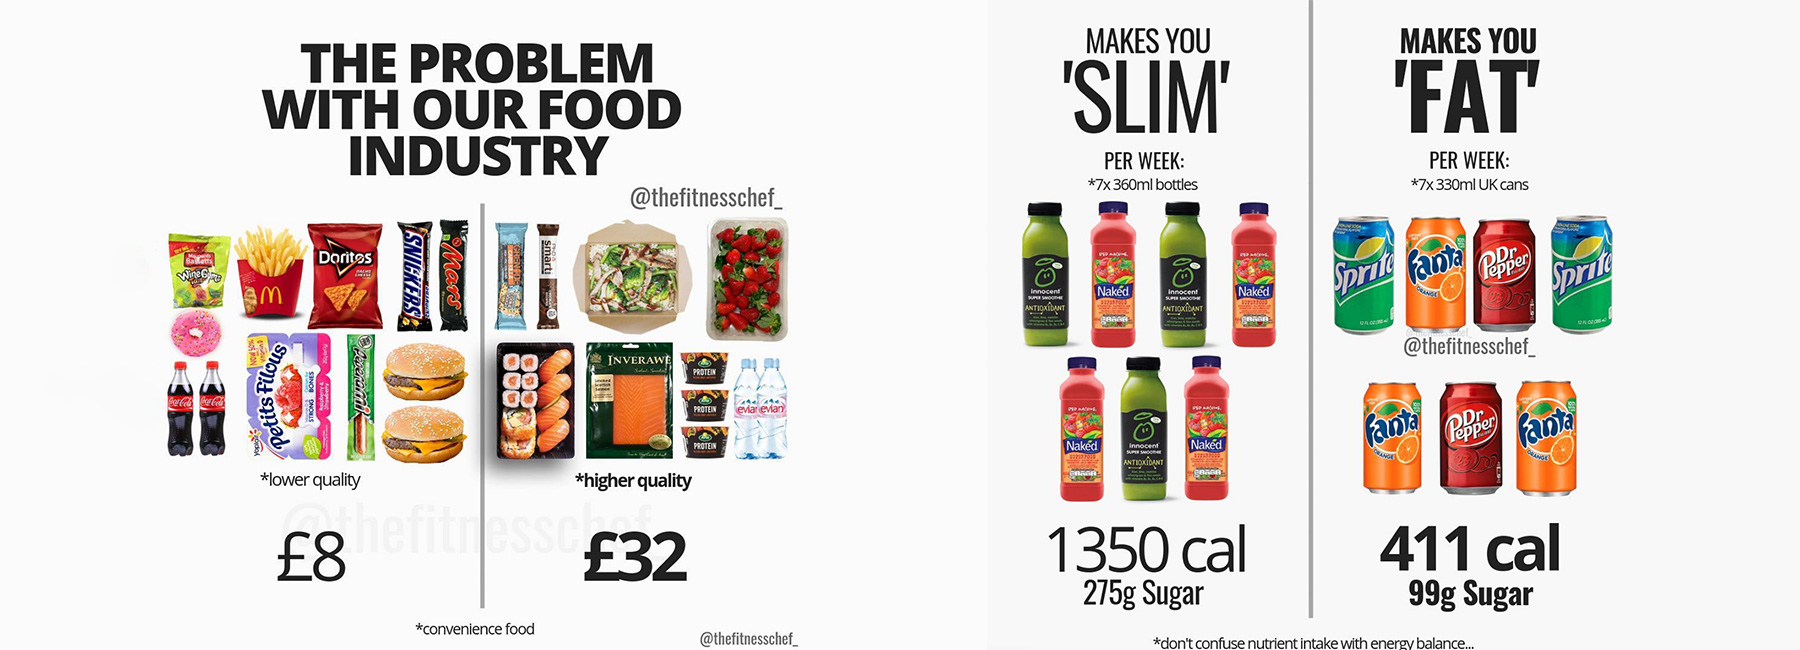
infographics (21 articles)
artist visualizes the lengthy terms of services of large corporations like facebook and instagram
#art
the project emphasizes the contractual obligations when subscribing for a service/app and guess which is the longest...
3D printed infographics by coming soon relay statistical data with playful plastic pieces
#design
colorful 3D printed forms have been made in the shape of pie charts, line, and bar graphs, with accompanying text delineating the collected data and exact figures.
nadeem haidary turns flags into symbolic, cultural infographics
#design
'state of the union' takes a set of metrics and visually transforms elements on the flag to represent the country's current state, making it a dynamic and information-driven »
'state of the union' takes a set of metrics and visually transforms elements on the flag to represent the country's current state, making it a dynamic and information-driven symbol.
interview with graphic designer nicholas felton
#design
nicholas felton spends much of his time thinking about data, charts and our daily routines.
data cuisine by moritz stefaner visualizes information through food
#design
facts and statistics are rendered through more digestible means, displayed and experienced through culinary means.
8,080 colored pencils chronicle university of minnesota's history
#art
the specific contour of the panels reflects important eras and historical periods of the school, while the hues of the pencils echo the school's evolving degree programs.
census infographic exposes racial segregation in america
#design
one colored dot per person creates a virtual snapshot of america's racial divide.
peter grundy (grundini) interview
#design
peter grundy is an illustrator and designer who has specialized in information design for over thirty years.
where to be born from 1988 to 2013
#design
the infographic looks at a calculation of where it is best to be born in the world from 1988 to 2013.
2012 in review infographic GIF by yiying lu
#art
the artwork features major events in current affairs throughout the year of 2012 including the london olympics, the kony campaign and the second term election of president obama.
phrenology brain infographics
#art
phrenology is a pseudoscience primarily focused on measurements of the human skull, based on the concept that the brain is the organ of the mind, and that certain brain areas have »
phrenology is a pseudoscience primarily focused on measurements of the human skull, based on the concept that the brain is the organ of the mind, and that certain brain areas have localized, specific functions or modules.
arthur buxton: vogue covers covered
#readers
a set of graphic explorations that map the historic 130 years of vogue magazine covers in 1800 different colors.
one hour per second by google data arts + punk & butler
#design
every second, one hour of video is uploaded onto youtube. that adds up to one century of video every year. the statistics were translated into mind-bending infographics.
arthur buxton: color trend visualizations
#design
the charts are designed to be visually pleasing, but also function as a color trend visualization tool. each circle represents a famous painting, portraying the five most »
the charts are designed to be visually pleasing, but also function as a color trend visualization tool. each circle represents a famous painting, portraying the five most prominent colors as a percentage.
sunshine and happiness infographic
#design
does sunshine really make you happier? an infographic by leigh riley and arena quantum investigates, compiling country-by-country information about sunlight and satisfaction.
IKEA stonehenge infographic by justin pollard
#design
an infographic by british writer justin pollard offers ikea-style instructions for the construction of stonehenge.
michael deal world cup infographics for umbro
#design
umbro recently commissioned graphic designer michael deal to bring the stats from this year's FIFA world cup to life. so far michael has completed infographics displaying the »
umbro recently commissioned graphic designer michael deal to bring the stats from this year's FIFA world cup to life. so far michael has completed infographics displaying the action from the 48 group games…
audree lapierre: infographic nutrition data
#design
montreal-based graphic designer audree lapierre set out to redesign the way nutritional data is displayed on food packaging.
infographic money concept
#technology
tokyo based designer mac funamizu wondered what would happen if we rethought how coins were designed with an infographic perspective
la mosca: infographics and other work
#design
la mosca is a graphic design studio located in barcelona, spain. they produce identity schemes, exhibition graphics, magazine layouts and have a penchant for infographics. you »
la mosca is a graphic design studio located in barcelona, spain. they produce identity schemes, exhibition graphics, magazine layouts and have a penchant for infographics. you might have seen their work in publications such as monocle, wired and la vanguardia.
personal infographics
#design
a lot of people keep simple journals or take pictures to record their thoughts and track their activities, however other people make elaborate and meticulous infographics.