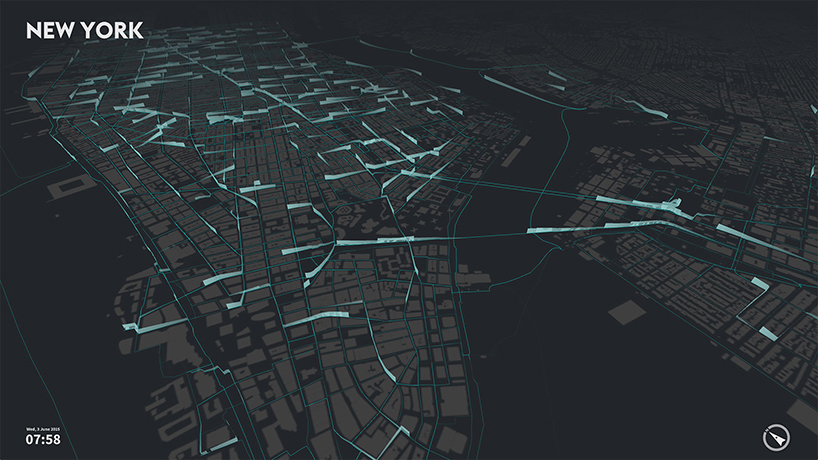
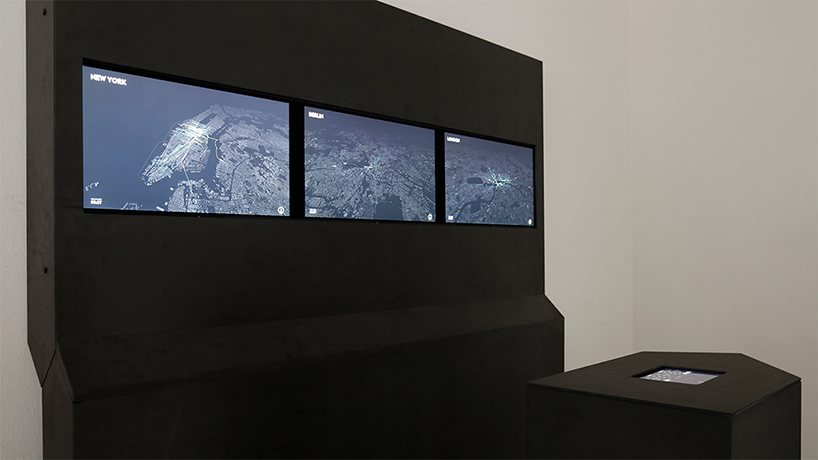
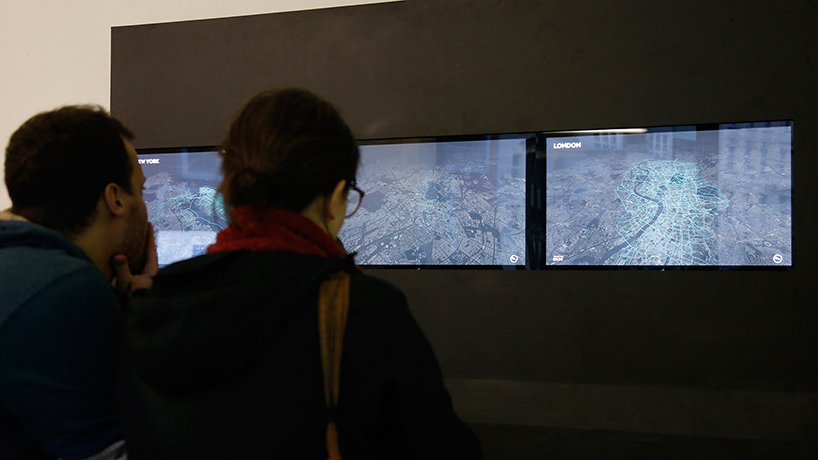
cf city flows urban bike mapping installation hosted by potsdam’s urban complexity lab: three high-resolution screens created by two visual design researchers in potsdam, germany, let visitors compare flows of urban mobility in london, new york city and berlin, as seen through the journeys of shared bikes. by showing the flow of multiple cities side by side, viewers can compare their scale and dynamics. tracing urban movements accentuates different urban structures, and contrasts grid-plan cities like new york, with historically grown cities, such as berlin. it also shines a light on similarities and differences in various bike-sharing systems. with these visualizations the urban complexity lab want to understand the pulse of urban mobility and create portraits of a city defined by its transient dynamics.

cycling is increasingly recognized as critical component of future urban mobility. riding a bike is largely independent of other traffic and unaffected by road congestion, plus has health and environmental benefits. in the last few years, many cities around the world installed bike-sharing systems in order to stimulate casual use of bicycles by locals and visitors alike. data from these systems aided cf. city flows to visualize various aspects of bike-sharing mobility.

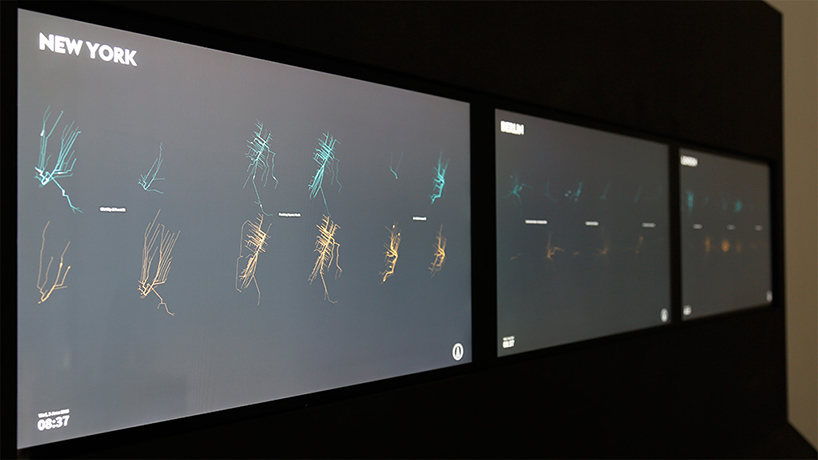
the map has three viewing modes, all visualizing trips of rented bikes, but focusing on different levels of spatial and temporal granularity of cycling mobility: the citywide view aggregates all trajectories of bike-sharing trips for a given day and animates the trails for trips at a given time; in the station view only the bike trips to and from a selected station are shown, allowing the distinction between incoming and outgoing; a small-multiple view visualizes space and time patterns for three selected stations each in an exploded view that separates incoming from outgoing and morning from afternoon/evening trips.

visitors can switch between these viewing modes resulting in smooth transitioning into the next scene. each view shows an animation moving through the day and highlights bike trips of the current time with a fading trail for better visibility. the views of all three screens are temporally and spatially coordinated, showing the same time of day and having the same map scale. lacking actual GPS tracks, trip trajectories are rendered as smooth paths of the calculated optimal bike routes. as different trajectories still share some segments of the street network, aligning the bike movements with actual roads makes it possible to compare the accumulated use of urban infrastructure
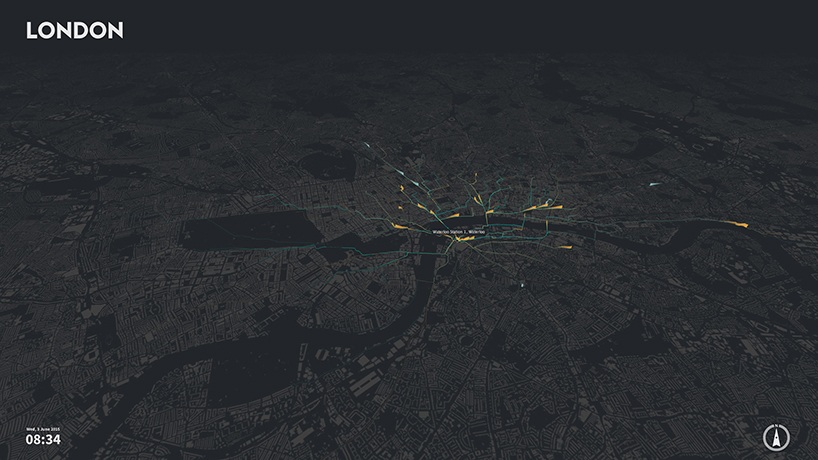
the map’s main purpose is to give visitors a quick overview of the city and provide the backdrop for the bike-sharing visualizations. the design of the ‘basemaps’ are inspired by the historic nolli map, containing a figure/ground distinction between private and public areas. the most precise building data available has been used for all three cities , with the UK making its data open just before the launch of the visualization.
PRODUCT LIBRARY
 Apr 22, 2024
 Mar 21, 2024
 Mar 13, 2024
 Feb 24, 2024