RESEARCHERS USED SATELLITE DATA TO DETECT MASSES OF PLASTIC FLOATING IN THE OCEAN
NASA has released an animation showcasing changing plastic concentrations in the oceans over an 18-month period. the video is based on a new tracking method developed by researchers at the university of michigan who used satellite data to detect and track the masses of plastic floating in the ocean.
yearly, about 8 million tons of plastic flow from rivers and beaches into the ocean. they are carried by ocean currents and broken down by waves and sunlight into smaller microplastics. most ends in large garbage patches like the great pacific garbage patch, located between california and hawaii.

image by sören funk on unsplash
1% OF PLASTIC FLOATS, THE REMAINING 99% IS TURNED INTO MICROPLASTICS
scientist have discovered the only 1% of plastic floats, while 99% of it is turned into microplastics. the latter one reaches the ocean floor and will remain there until it slowly begins to break down and become part of the seabed. researches have even found microplastics dating back to the 1950s.
the new mapping method measures the concentration of ocean microplastics around the world by collecting data from eight microsatellites, part of the cyclone global navigation satellite system (CYGNSS). radio signals from GPS satellites reflect off the ocean surface and CYGNSS satellites detect those reflections. scientist then take these signals to measure the roughness of the ocean surface. the measurements, usually used to derive ocean wind speeds, also reveal the presence of plastic. when there is plastic or other debris near the ocean surface, the waves are dampened and the sea surface is less rough.
‘in cleaner waters, there’s a high degree of agreement between ocean roughness and wind speed,’ said chris ruf, principal investigator of the CYGNSS mission and one of the authors of the research. ‘but as you head into the great pacific garbage patch, you see a bigger discrepancy between wind speed measurements and the roughness of the surface.’
‘working backward, the team looked for places where the ocean was smoother than expected given the wind speed, which they thought could indicate the presence of microplastics,’ said NASA. ‘then they compared those areas to observations and model predictions of where microplastics congregate in the ocean. the scientists found that microplastics tended to be present in smoother waters, demonstrating that CYGNSS data can be used as a tool to track ocean microplastic from space.’
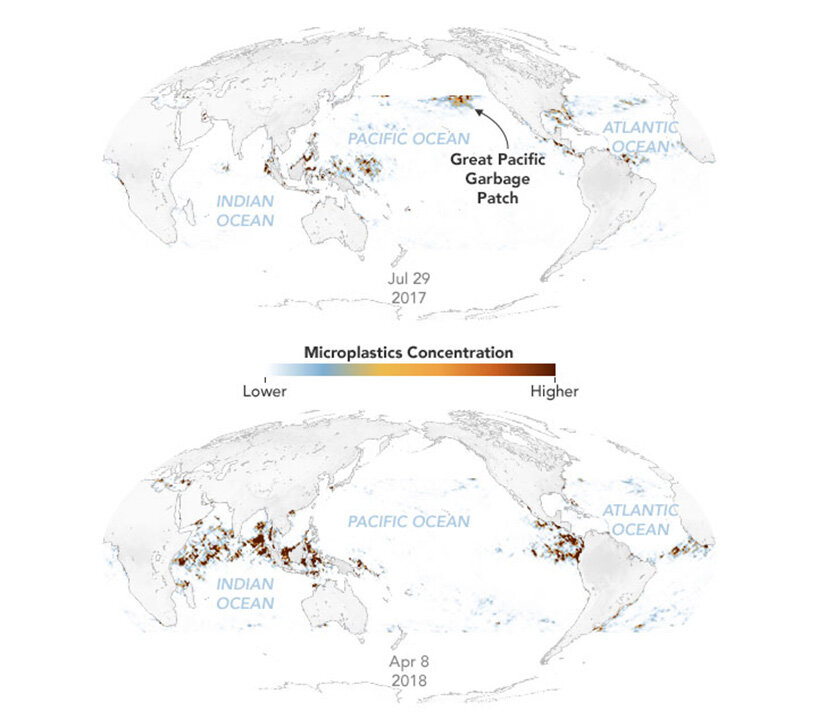
the animation shows the location and concentration of floating plastics between april 2017 and september 2018. the data reveals seasonal variations in microplastic concentration where it appears to be larger in the summer and lower in the winter. this is probably due to more vertical mixing of the ocean when temperatures are cooler.
project info:
name: toward the detection and imaging of ocean microplastics with a spaceborne radar
more info: here
NASA (175)
 May 15, 2024
 Apr 03, 2024
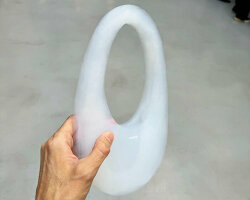 Mar 05, 2024
 Jan 15, 2024
ocean awareness and activism (151)
 Dec 13, 2023
 Oct 12, 2023
 Oct 06, 2023
 Aug 11, 2023
 Jul 24, 2023
PRODUCT LIBRARY
 Jul 22, 2024
 Apr 22, 2024
 Mar 21, 2024
 Mar 13, 2024