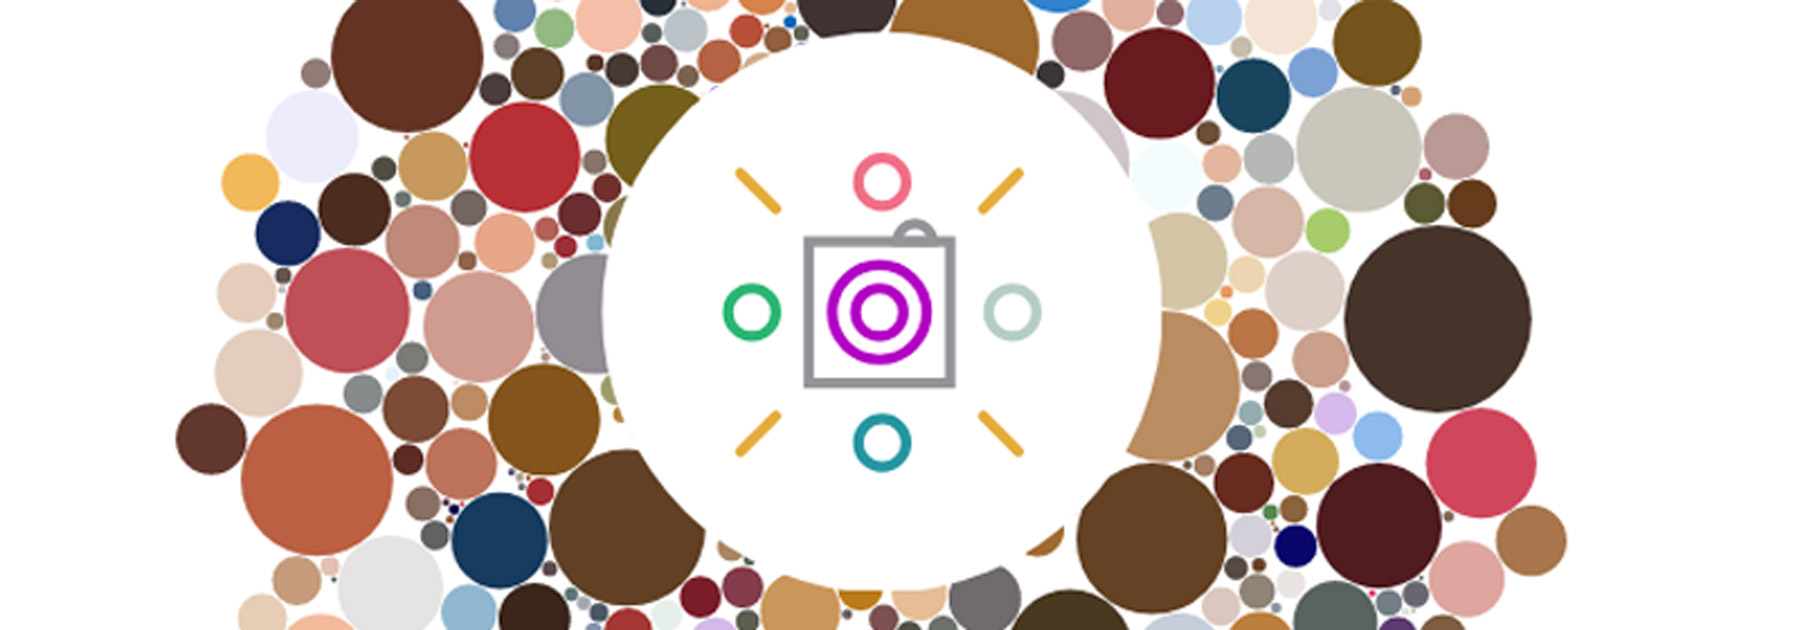
you may have noticed the abundance of ‘top 9’ posts being shared recently on instagram as we move from 2018 into 2019. now thanks to makelight’s ‘year of colour’, you can track the most predominately used colors from your instagram photos over the past year. the new app takes the information from your posts and generates an abstract color report based on your personal feed.
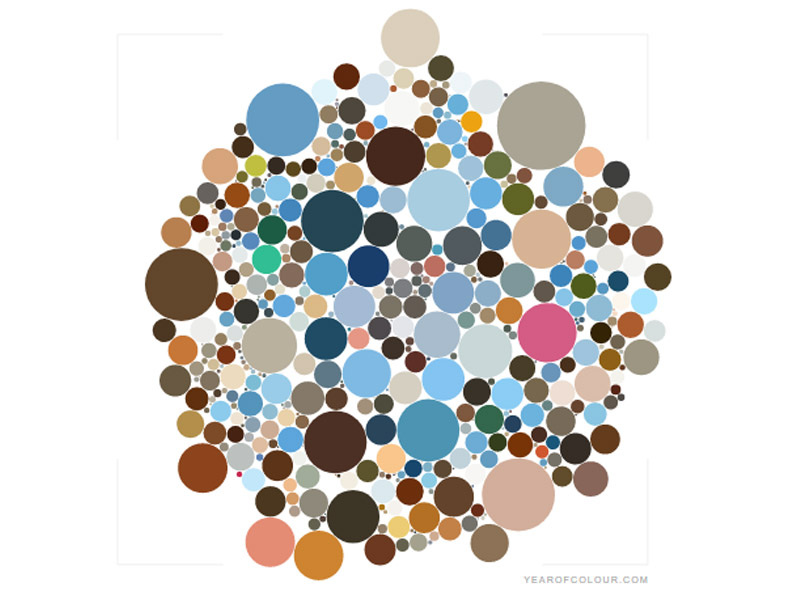
image © year of colour (also main image)
makelight is run by husband and wife team, stef lewandowski and emily quinton. from their south london base they have created the app together to provide a snapshot into how we use color and how it personifies our social media. to use, simply go to the year of colour website and log in with your instagram account. from there you can choose the time frame and the app automatically produces your personal pattern of color. the app also shows the colors in relation to your most liked images – the bigger the dot, the more likes it has received.
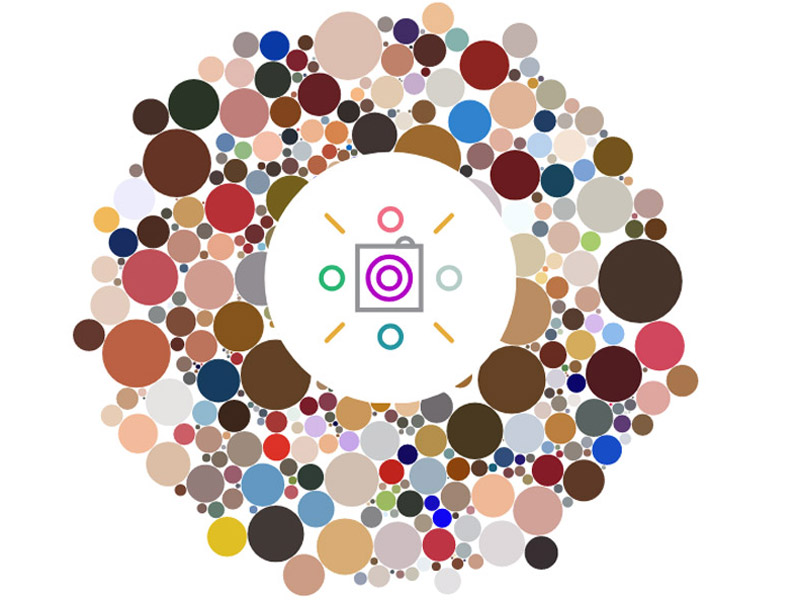
image © year of colour
in addition to being a fun application, it can also be used to provide a detailed analysis on the colors we use and which colors have gained the most positive attention. the dots show at a glance how color affects the tone and popularity of posts. the resulting reports can be downloaded in high resolution or even ordered as a beautiful graphic print for your home.
project info:
project name: ‘year of colour’
app design: makelight
APPS (140)
 Apr 03, 2024
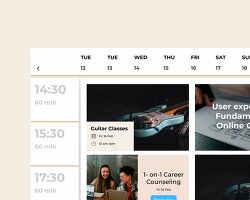 Mar 25, 2024
 Mar 04, 2024
 Nov 09, 2023
 Nov 03, 2023
PRODUCT LIBRARY
 Apr 22, 2024
 Mar 21, 2024
 Mar 13, 2024
 Feb 24, 2024